7 Important XRP Indicators Related to ETFs and Breakouts that Determine Crypto Price Direction
Jakarta, Pintu News – XRP (XRP), one of the largest cryptocurrency assets by market capitalization, is now at an important technical crossroads after a period of strong spot ETF inflows followed by a recent decline in institutional demand, creating a market picture that awaits breakout confirmation. XRP price remains above key levels while technical patterns and holder accumulation dynamics suggest a conflict between bullish momentum and price resistance.
1. ETF Inflow Decline Delays Breakout
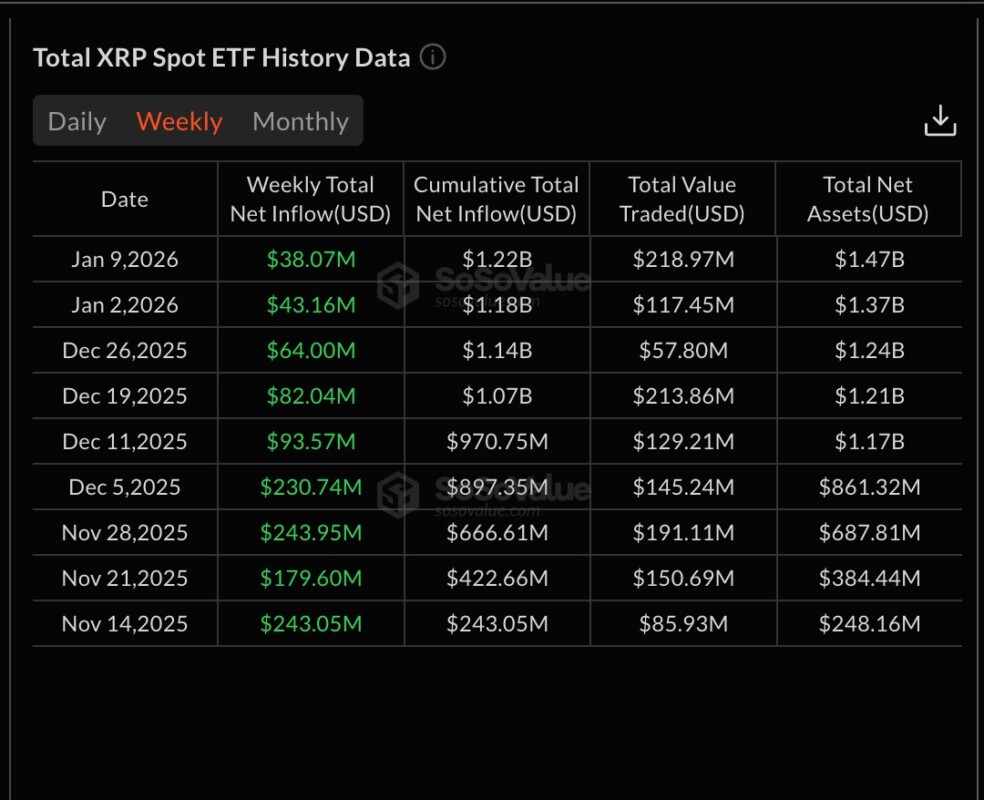
Inbound demand into the spot XRP ETF hit a weekly low since launch, with net inflows of only around $38.07 million, down nearly 84 percent from its peak in late November. This decline coincided with a slowdown in price momentum, affecting the confirmation of the bullish breakout pattern that was initially seen.
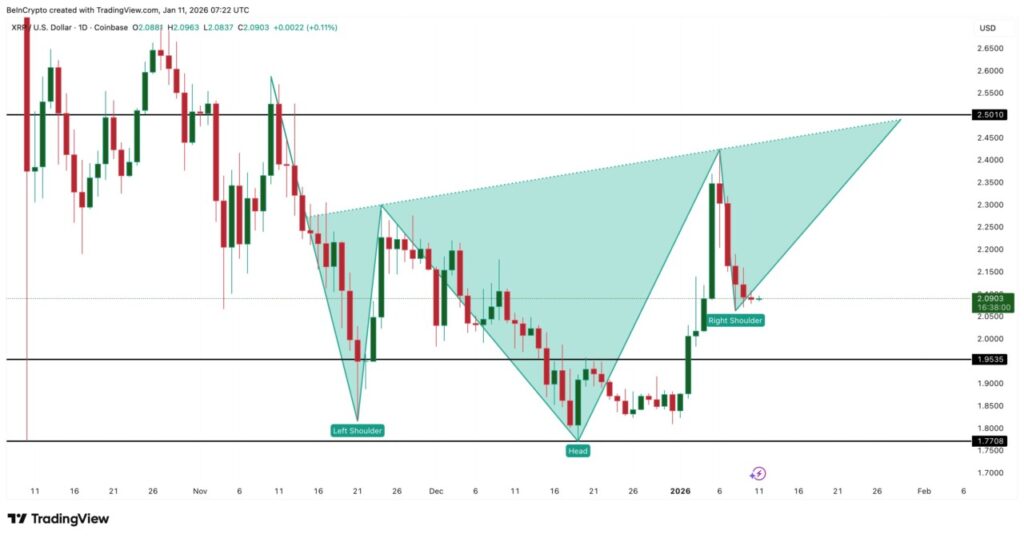
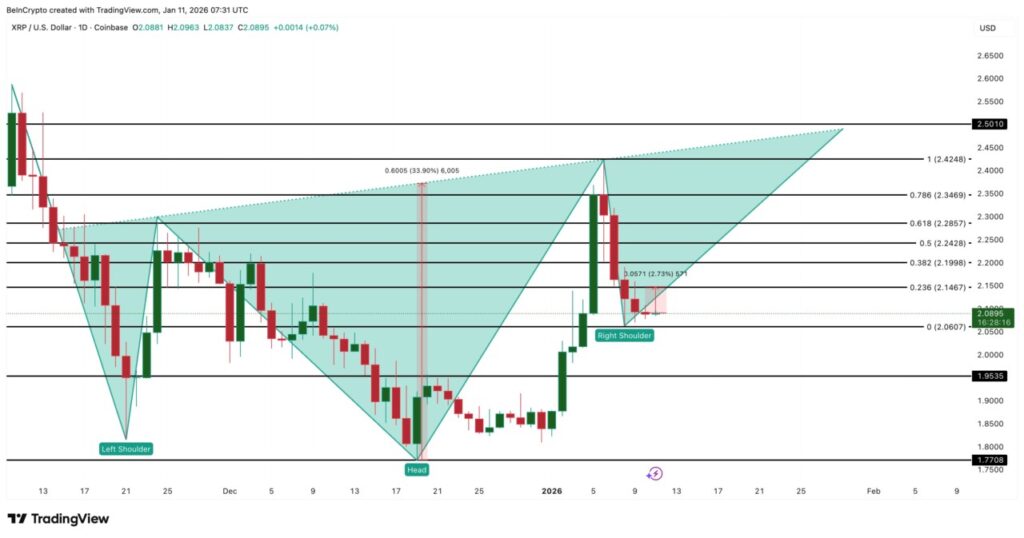
This condition is directly related to the chart structure of the inverse head and shoulders pattern, where the price is still below theneckline, which is an important level to trigger a higher rise. The decline in ETF inflows at this crucial phase of the technical pattern explains why the breakout has yet to materialize.
The period of weak inflows suggests the institutional market has yet to provide sustained price support, so XRP’s breakout momentum is now largely dependent on the return of significant ETF demand.
Also Read: XRP 2026 Price Prediction: Is This Investment Still Promising?
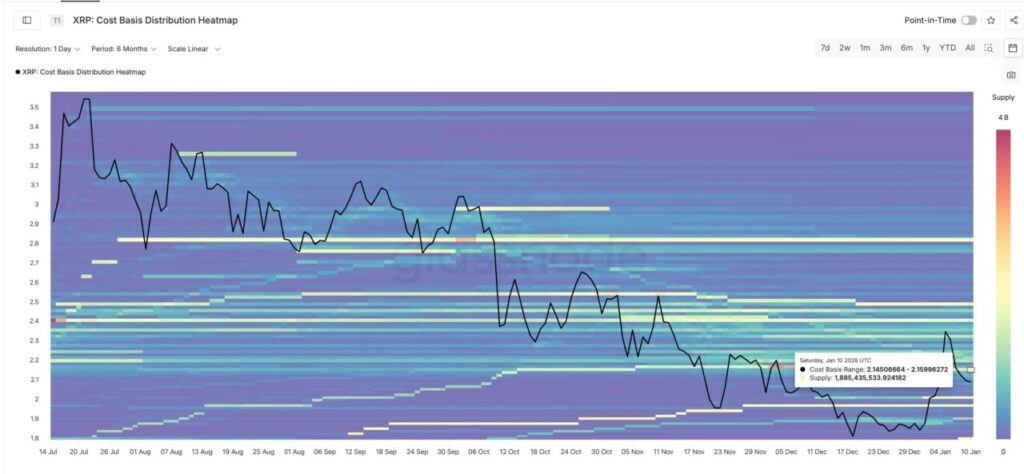
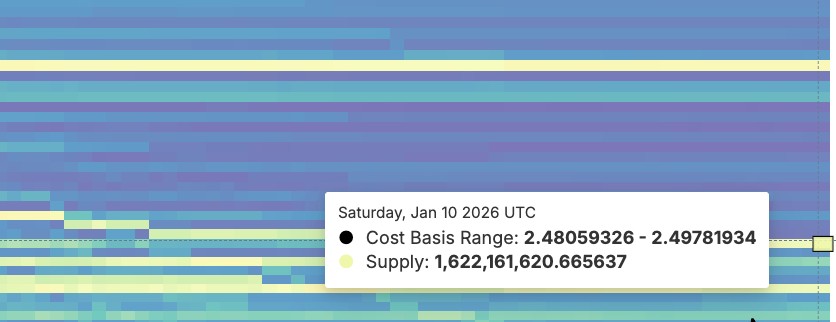
2. Holder accumulation rises sharply
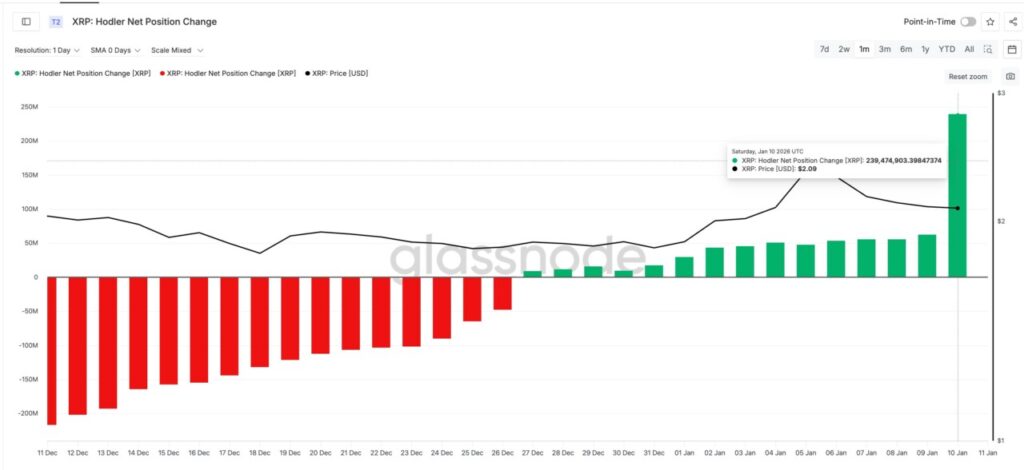
Amid weakening demand for ETFs, on-chain data shows that long-term holders of XRP increased accumulation significantly. Net position additions by holders increased from approximately 62.4 million XRP to 239.5 million XRP, equivalent to nearly 300 percent in a single day, showing long-term confidence.
This accumulation phenomenon plays a role in absorbing selling pressure and stabilizing prices in critical areas, thereby reducing the risk of further declines despite declining ETF inflows.
The need for a strong combination of institutional demand and holder accumulation is a key indicator to see if the technical pattern will move from stagnation to a real breakout.
3. Key Price Levels that Determine Breakouts
To achieve breakout confirmation, XRP price needs to close above $2.15 (approx . IDR35,976) which is part of a large supply zone, and then face important resistance around $2.28 and $2.50. A close above $2.50 will mark the confirmation of the inverse head and shoulders pattern breakout.
Clearing this resistance level indicates that bullish sentiment is dominating so demand is strong enough to push prices higher, overcoming the large supply cluster that is holding back the upside.
Conversely, if the price drops below $2.06 (approx . IDR 34,467), it could weaken the existing bullish structure and reduce the chances of a short-term breakout.
4. Impact of Broader Crypto Market Sentiment
The general cryptocurrency market sentiment has an effect on XRP’s movement, where national and global correction phases may exacerbate selling pressure or delay breakout momentum, despite strong holder accumulation.
General price corrections in digital assets often pull capital out of altcoins like XRP, making technical resistance harder to break without broader market support.
However, the stabilization or rebound phase of the crypto market may accelerate the process of XRP price increase if it is supported by positive technical indications and institutional demand returns.
5. Technical Charts and Price Patterns
The still intact inverse head and shoulders structure suggests that theoretically the XRP price is on a bullish path if the pattern is confirmed, but other parameters such as trading volume and trend strength remain worth noting.
This pattern is seen as one of the medium-term bullish signals, but its confirmation depends on a clear breakout above the neckline.
In addition, other indicators such as Fibonacci retracement and support/resistance data also strengthen the technical analysis of potential further price movements.
6. Evaluating the Role of ETFs in Institutional Demand
Specifically, the spot XRP ETF previously recorded a period of strong inflows, but the decline in inflows suggests a consolidation phase of the institutional market that precedes further bullish momentum.
This change in ETF flows has a direct effect on the perceived demand for XRP as a crypto asset of interest to large investors, so it will continue to be an important indicator in predicting breakouts.
As ETFs continue to operate, the pattern of institutional capital flows will be one of the main factors in determining medium to long-term trends.
7. Risk Factors and Uncertainties
Although technical patterns and accumulation of holders indicate positive momentum, the risk of a delayed breakout remains high if institutional demand does not recover or cryptocurrency market pressure increases sharply.
Market liquidity, regulatory changes and global investor sentiment dynamics can also slow or accelerate breakout momentum, so careful analysis of these indicators is still required. Real-time monitoring of key price levels, ETF volumes and holder activity will continue to provide key guidance for future price trends.
Also Read: Raydium Price Prediction 2026: Significant Upside Potential in the Solana Ecosystem
Follow us on Google News to get the latest information about crypto and blockchain technology. Check Bitcoin price today, Solana price today, Pepe coin and other crypto asset prices through Pintu Market.
Enjoy an easy and secure crypto trading experience by downloading Pintu crypto app via Google Play Store or App Store now. Also, get a web trading experience with various advanced trading tools such as pro charting, various types of order types, and portfolio tracker only at Pintu Pro.
*Disclaimer
This content aims to enrich readers’ information. Pintu collects this information from various relevant sources and is not influenced by outside parties. Note that an asset’s past performance does not determine its projected future performance. Crypto trading activities are subject to high risk and volatility, always do your own research and use cold hard cash before investing. All activities of buying andselling Bitcoin and other crypto asset investments are the responsibility of the reader.
Reference:
- Ananda Banerjee/BeinCrypto. XRP ETFs Remain in Green but Inflows Hit a Record Low: How Will Price React? Accessed January 12, 2026.
Latest News
© 2026 PT Pintu Kemana Saja. All Rights Reserved.
The trading of crypto assets is carried out by PT Pintu Kemana Saja, a licensed and regulated Digital Financial Asset Trader supervised by the Financial Services Authority (OJK), and a member of PT Central Finansial X (CFX) and PT Kliring Komoditi Indonesia (KKI). Crypto asset trading is a high-risk activity. PT Pintu Kemana Saja do not provide any investment and/or crypto asset product recommendations. Users are responsible for thoroughly understanding all aspects related to crypto asset trading (including associated risks) and the use of the application. All decisions related to crypto asset and/or crypto asset futures contract trading are made independently by the user.