3 Extreme Indicators that Show Bitcoin Market is Already in Panic Phase
Jakarta, Pintu News – Bitcoin (BTC) sales rallied again on Thursday as the price fell below US$69,000, the lowest level since Nov. 6, 2024. Some analysts think the market is starting to show signs of “full capitulation” and the potential formation of a bottom.
The main indicators highlighted are the aggressive sell-off of short-term holders, the spike in fear on the Crypto Fear & Greed Index, as well as the extremely oversold condition of the relative strength index (RSI) indicator across multiple time frames.
Short-term Holder Capitulation Rises Sharply
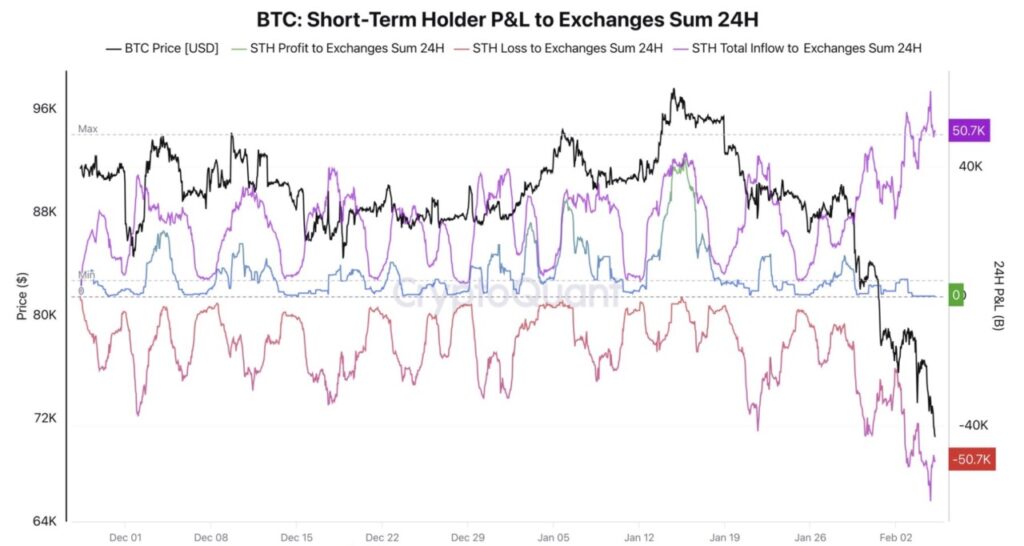
CryptoQuant data shows that nearly 60,000 BTC – about US$4.2 billion at current prices – held by short-term holders (STHs) were moved to exchanges in the last 24 hours at a loss. This was the largest inflow to exchanges since the start of the year and directly added to selling pressure in the spot market.
CryptoQuant analyst Darkfost thinks the correction this time is so deep that almost no Bitcoin belonging to long-term holders has been moved in profit, calling the situation a “full capitulation”.
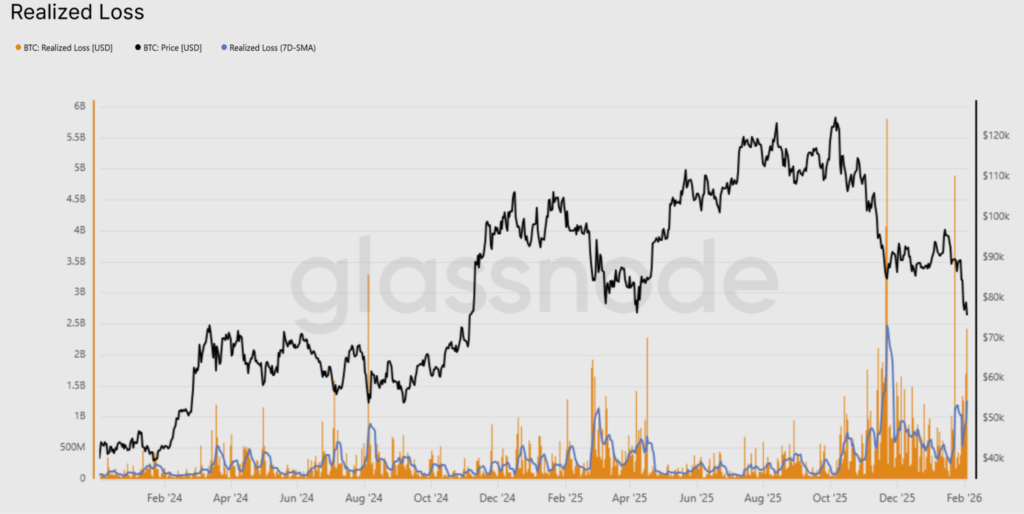
Glassnode noted that 7-day SMA realized losses have breached US$1.26 billion per day, reflecting a sharp increase in fear among market participants. In previous cycles, such spikes in realized losses often appeared in phases when marginal selling pressure started to lose steam.
Glassnode also reported the second major spike in its “capitulation metric” in the past two years, which typically coincides with phases of aggressive de-risking and high volatility as the market resets positions.
Also read: Bitcoin Breaks $64,000, Selling Pressure Gets Extreme: Where is BTC’s Bottom?
Fear & Greed Index enters extreme fear zone
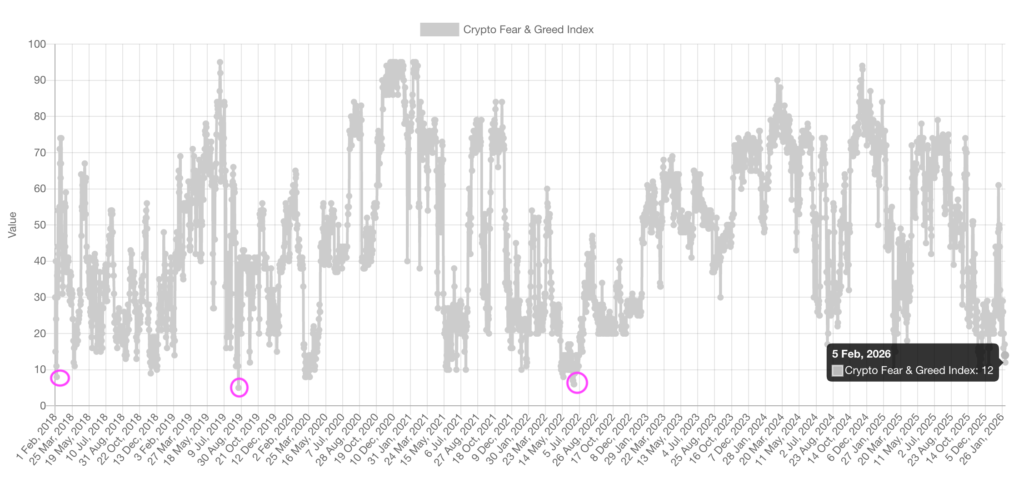
The Crypto Fear & Greed Index for the crypto market recorded an “extreme fear” score of 12. This level of fear last appeared in July before BTC formed a bottom around US$15,500 and then entered a bull trend.
Historically, whenever the index hits this extreme area, short-term weakness is still possible, but many instances are followed by a rebound phase.
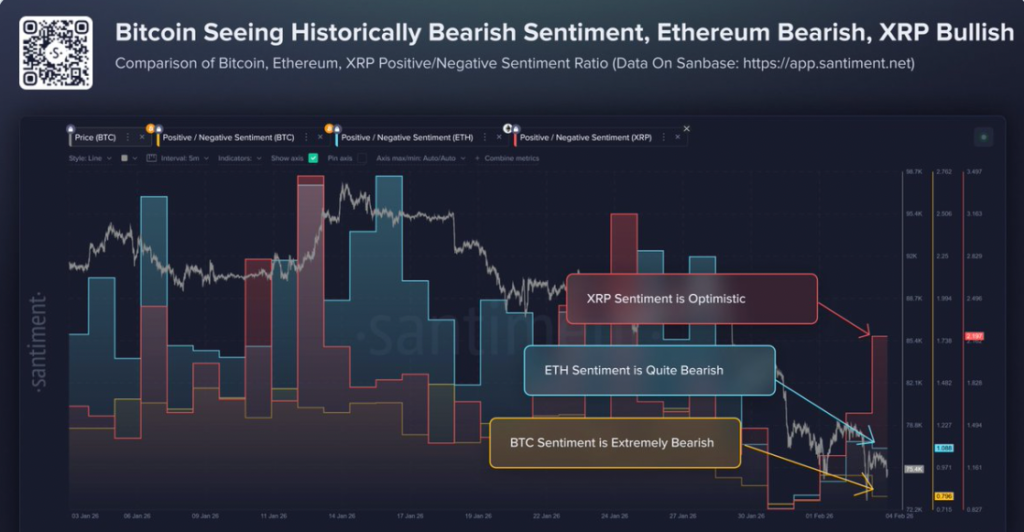
Analyst Davie Satoshi believes that the current Fear & Greed level – even at 11 – has historically been an accumulation zone, not a distribution zone. Sentiment analytics platform Santiment also noted that investors’ views on Bitcoin are now “very bearish”, a condition that often fuels short-term relief rallies. As long as the majority of retail players still show distrust of cryptocurrencies in general, the opportunity for a technical bounce is considered to remain open.
Read also: Bitcoin’s chances of breaking $90,000 are slim, options market already “throwing up its hands”?
Bitcoin RSI Most Oversold Since FTX Crash Phase
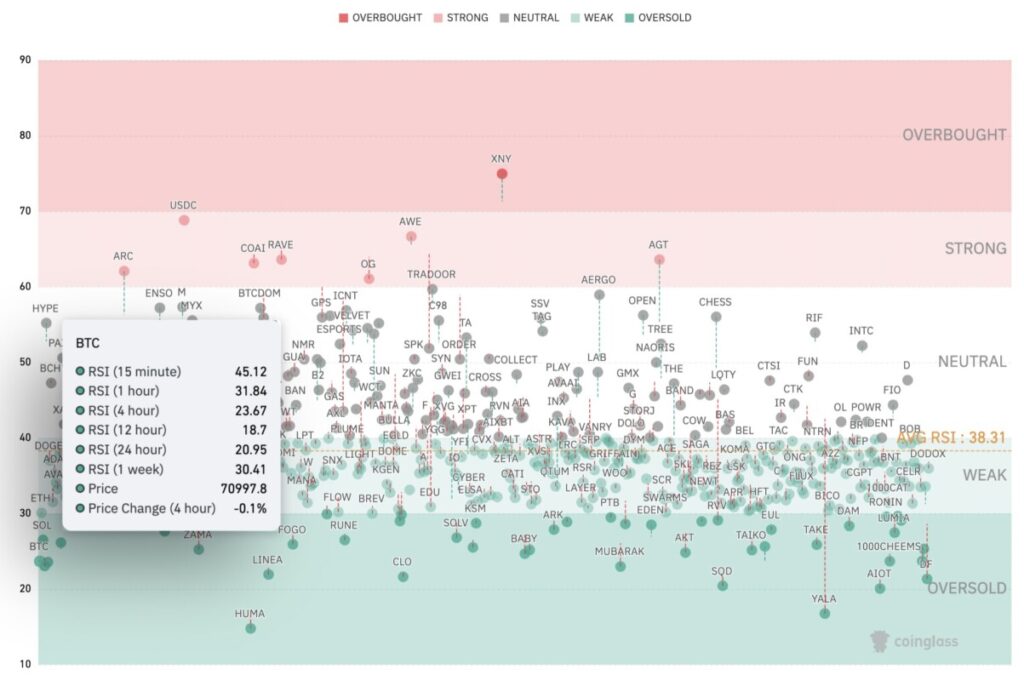
Coinglass’ RSI heatmap shows Bitcoin is oversold in five of the six time frames monitored. BTC’s RSI hovers around 18 on the 12-hour chart, 20 on the daily, and 23 on the 4-hour, while the weekly and hourly RSI are each in the 30-31 range, which is also close to oversold territory. TradingView data puts the weekly RSI at 29, the most oversold level since the 2022 bear market.
CryptoXLARGE analysts note that Bitcoin is now “the most oversold since the FTX crash”, reflecting the scale of panic selling in the market. According to him, historically points like this often mark the peak of fear and the beginning of opportunity.
The HodlFM analyst added that the RSI is now in a similar area to when BTC was around US$16,000 in 2022, which was the last major capitulation phase. He emphasized that the RSI is not a perfect timing signal, but historically the risk-reward ratio in zones like this tends to start favoring buyers.
Conclusion
Three key indicators-the aggressive capitulation of short-term holders, the Crypto Fear & Greed Index in the “extreme fear” zone, and a severely oversold RSI across multiple time frames-describe the already highly depressed state of the Bitcoin market. While it does not guarantee that a short-term price bottom has been reached, this combination of signals often appears near large capitulation phases in previous cycles.
For market participants, the current situation indicates that selling pressure may be nearing a peak, while relief rally opportunities are starting to open up, while recognizing that high volatility and downside risks have not completely disappeared.
Follow us on Google News to stay up to date with the latest in crypto and blockchain technology. Check Bitcoin price, usdt to idr and tokenized nvidia stock price via Pintu Market.
Enjoy an easy and secure crypto trading experience by downloading the Pintu crypto app via Play Store or App Store now. Also, experience web trading with advanced trading tools such as pro charting, various types of order types, and portfolio tracker only at Pintu Pro.
*Disclaimer
This content aims to enrich readers’ information. Pintu collects this information from various relevant sources and is not influenced by outside parties. Note that an asset’s past performance does not determine its projected future performance. Crypto trading activities are subject to high risk and volatility, always do your own research and use cold hard cash before investing. All activities of buying and selling Bitcoin and other crypto asset investments are the responsibility of the reader.
Reference:
- Cointelegraph. Three signs that Bitcoin price could be near ‘full capitulation’. Accessed February 7, 2026.
- Featured Image: Generated by Ai
Latest News
© 2026 PT Pintu Kemana Saja. All Rights Reserved.
The trading of crypto assets is carried out by PT Pintu Kemana Saja, a licensed and regulated Digital Financial Asset Trader supervised by the Financial Services Authority (OJK), and a member of PT Central Finansial X (CFX) and PT Kliring Komoditi Indonesia (KKI). Crypto asset trading is a high-risk activity. PT Pintu Kemana Saja do not provide any investment and/or crypto asset product recommendations. Users are responsible for thoroughly understanding all aspects related to crypto asset trading (including associated risks) and the use of the application. All decisions related to crypto asset and/or crypto asset futures contract trading are made independently by the user.