Ethereum Reclaims $2,000 as Whales Accumulate $18 Billion ETH Position
Jakarta, Pintu News – The price of Ethereum (ETH) recorded an increase of about 3.4% on February 25, extending therebound signal that started to be seen on the technical chart yesterday.
However, this recovery is allegedly more than just a momentary price bounce. A deeper analysis reveals a silent shift in positioning that may have gone unnoticed by many traders. Ethereum whales were observed aggressively accumulating amid the recent price collapse, even as leveraged positions collapsed and fear sentiment dominated the market.
Then, how will Ethereum price move today?
Ethereum Price Up 7.63% in 24 Hours
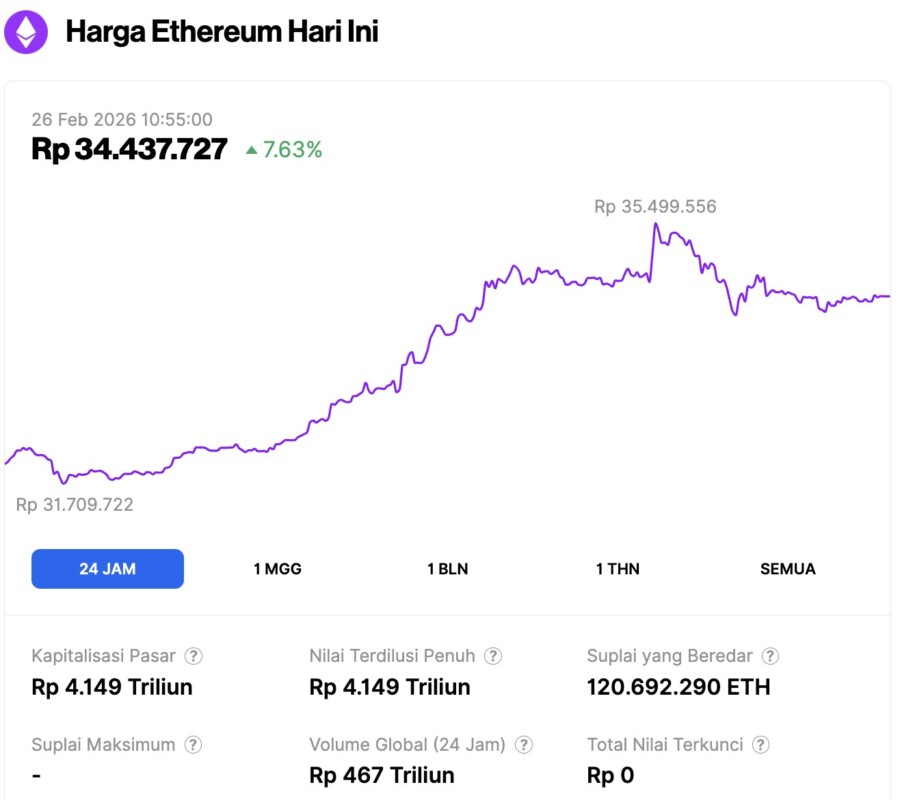
On February 26, 2026, Ethereum demonstrated significant bullish momentum, surging 7.63% over the last 24 hours to reach a price of $2,055—the equivalent of IDR 34,437,727. The digital asset experienced a highly active trading session, rebounding from an intraday low of IDR 31,709,722 to test a peak of IDR 35,499,556.
This price recovery is supported by a substantial increase in market activity. As of this writing, Ethereum’s market capitalization has solidified at approximately IDR 4,149 trillion. More notably, daily trading volume exploded by 35%, reaching IDR 467 trillion, signaling a sharp return of liquidity and investor interest in the ETH ecosystem.
Read also: Bitcoin Price Surges to $68,000 Today: Momentary Recovery or Early Bull Run Signal?
Ethereum Whale Adds 9 Million ETH Amid Price Crash and Leverage Collapse
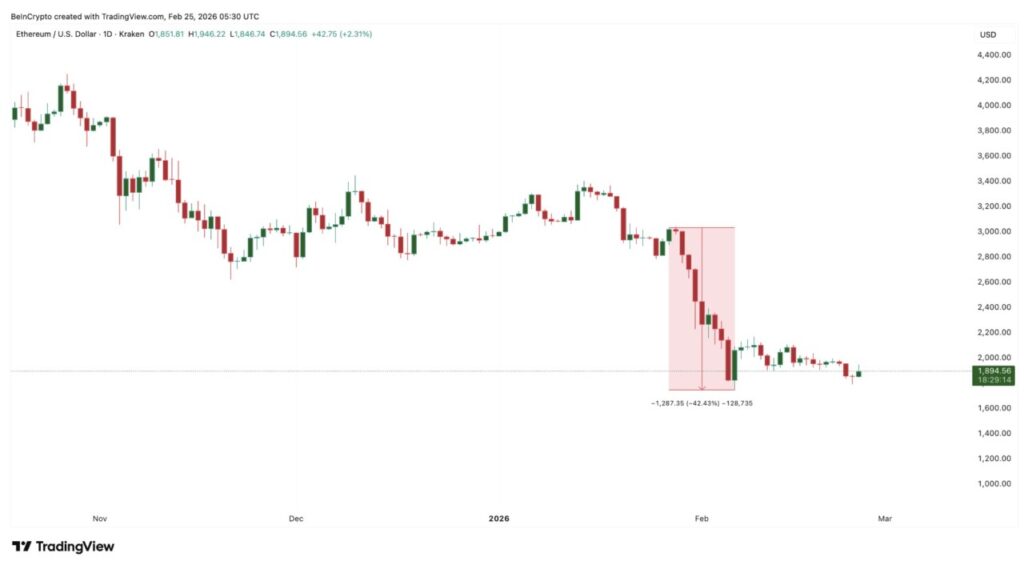
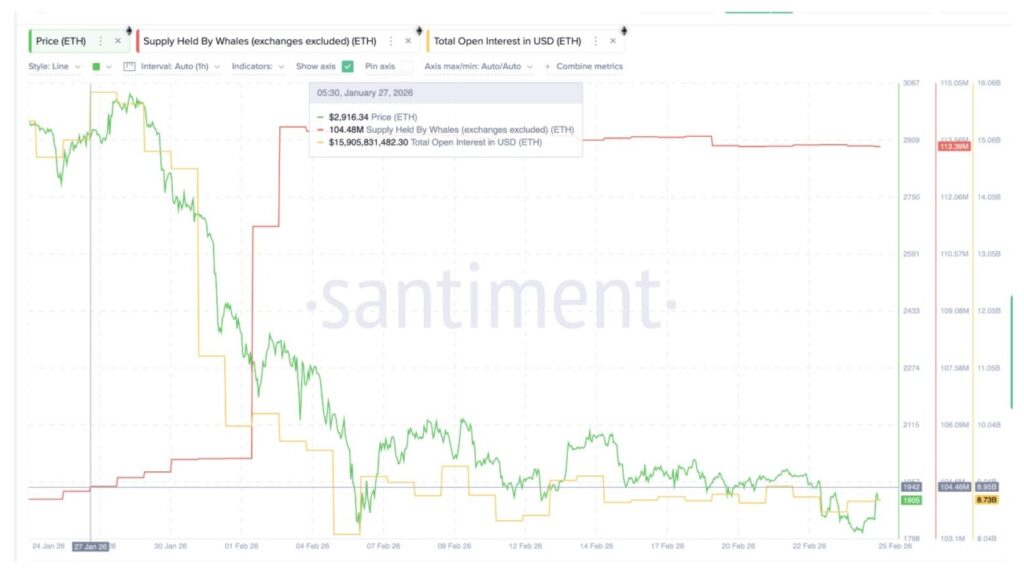
The recent Ethereum price crash wiped out both price and leverage. Between January 27 and February 6, Ethereum’s price plummeted by around 43%. In the same period, total open interest fell from $15.9 billion and is currently stuck at around $8.73 billion.
Open interest measures total leveraged futures positions, so this $7.17 billion decline confirms a massiveleverage flush.
A leverage flush occurs when traders using leverage are forced to exit their positions, usually during a sharp price drop. This process serves to remove speculative pressure from the market. However, while retail traders are forcedout, whales do the opposite.
Ethereum’s big holders increased their holdings from 104.48 million ETH on January 27 to 113.39 million ETH today, despite some minor sell-offs in between. This means the whales net added 8.91 million ETH during the crash period.
With an estimated average price of close to $2,100 during this period, the accumulated value is equivalent to about $18.7 billion.
This shows that the whales are notpanic-selling. Instead, they are absorbing asset supply duringforced liquidations. Such behavior usually signalslong-term positioning rather than just short-term trading.
Long-Term Holders and Exchange Flows Begin to Align with Whale Accumulation
The presence of whales alone is not enough to confirm a structural shift. Long-term holders (LTHs) must also show strongconviction.
Initially, long-term holders showed uncertainty. The HODLer Net Position Change metric remained negative for most of early February, indicating selling pressure even among seasoned investors. The price drop seemed to have swayed their stance. However, this behavior has recently undergone a change.
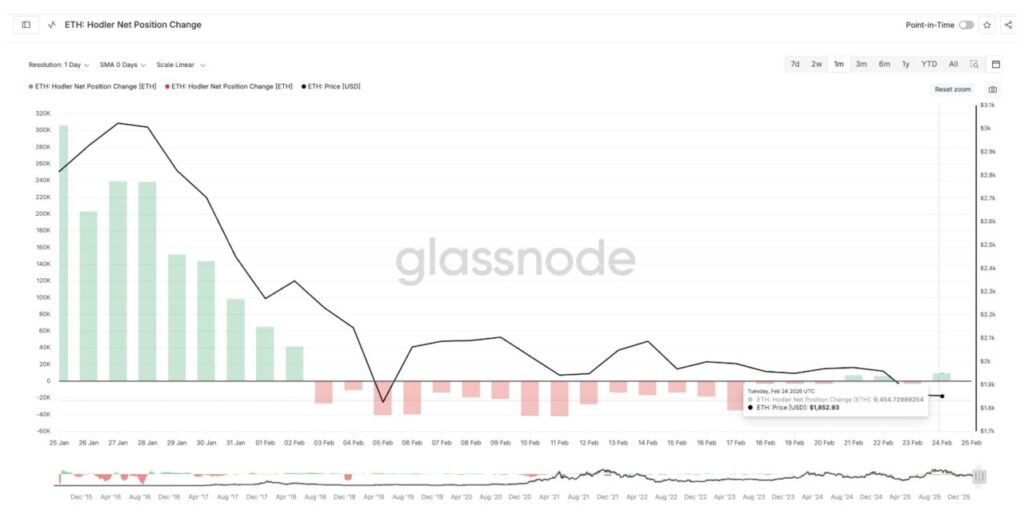
On February 21, long-term holders started accumulating again. By February 24, they added 9,454 ETH in a single day. This shift suggests that long-term investors began to align their positions with whale accumulation after weeks of hesitation.Exchange flow data adds another important layer of information.
The Exchange Net Position Change remains negative throughout the price crash period. A negative value means that coins were leaving the exchange instead of entering. This indicates that investors were moving their ETH to their personal wallets instead of preparing to sell them. For example, the exchange outflow reached 227,300 ETH on February 23.
Read also: Shiba Inu Price Prediction: ‘Death Cross’ Signal Appears, Will SHIB Plummet?
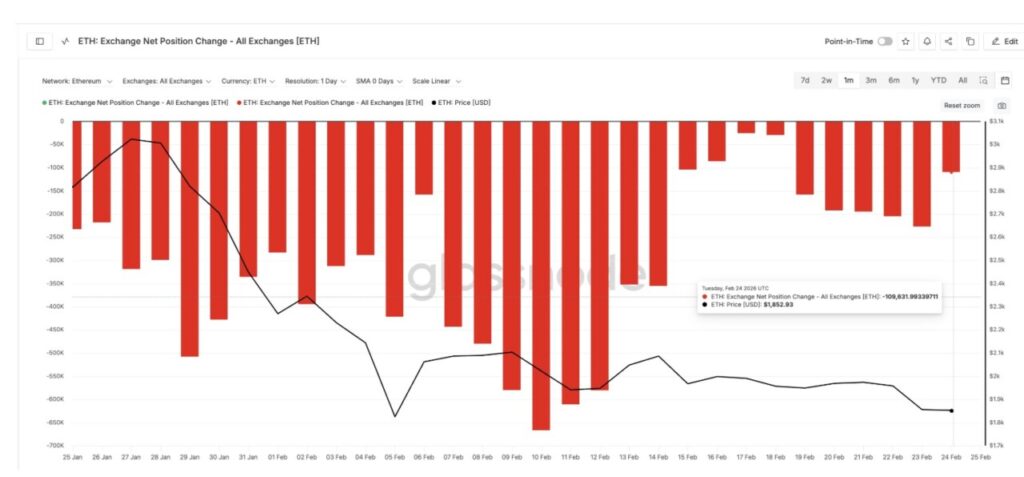
Although the outflow slowed to 109,631 ETH the following day, the trend still suggests net accumulation rather thanpanic selling.
Moreover, this drop in outflow figures could also be good news as short-term holders seem to have exited the market as well. The share of Ethereum supply held by short-term holders (the category that holds less than one week) dropped from 3.2% in early February to 2.1% currently. This trend is revealed through the HODL Waves metric, which separates investor cohorts based on duration of holdings.
This confirms that speculative traders have beenflushed out of the market, which also explains the lower outflow numbers. When “weak hands” exit and “strong hands” accumulate, the market often moves towards a structural low. This supports the bullish market shift thesis discussed earlier.

Ethereum Price Now Testing Structural Reversal Zone After Whale Accumulation
Ethereum’s price structure is now starting to reflect these accumulation signals. The Relative Strength Index (RSI), which measures momentum, shows a bullish divergence. Between November 21 and February 24, the Ethereum price formed alower low, but the RSI formed ahigher low.
This signals that the selling pressure is starting to weaken even though the price has yet to fully recover-a bullish technical signal that was mentioned earlier in the introduction.
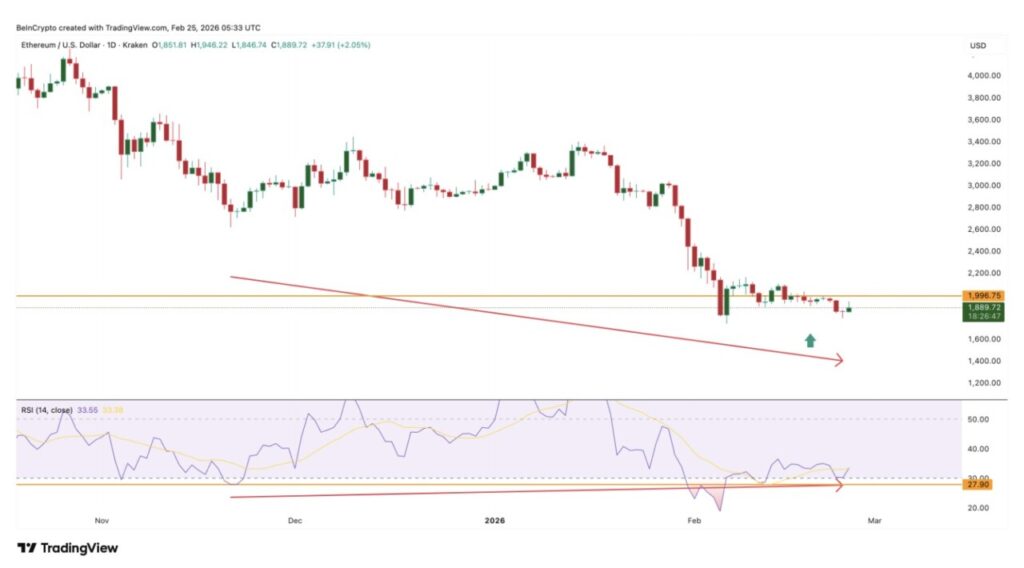
A similar divergence appeared on February 19, but most likely failed as the support from long-term holders was weak then. The currentsetup is different as accumulation is now happening simultaneously among whales, long-term holders, andexchange flows. This increases the probability of a strongerrebound attempt, or even a theoretical reversal.
Key Levels and Recovery Targets
Ethereum is now testing the critical recovery zone.
- First Resistance: Located at $1,990.
- Next Target: If it manages to break the level, the next target is $2,050.
- Bullish Confirmation: A move above $2,240 would confirm a larger recovery and signal that astructural bottom may have been formed. This represents an increase of about 20% from current levels.
However, downside risks remain looming. If Ethereum falls below $1,740 before bouncing higher, this structural bottom thesis will be invalidated. It would signal that the whales may be accumulating at alocal bottom, while the broader downtrend actually remains active.
Follow us on Google News to stay up to date with the latest in crypto and blockchain technology. Check Bitcoin price, usdt to idr and tokenized nvidia stock price via Pintu Market.
Enjoy an easy and secure crypto trading and crypto gold investment experience by downloading the Pintu crypto app via Play Store or App Store now. Also, experience web trading with advanced trading tools such as pro charting, various order types, and portfolio tracker only at Pintu Pro.
*Disclaimer
This content aims to enrich readers’ information. Pintu collects this information from various relevant sources and is not influenced by outside parties. Note that an asset’s past performance does not determine its projected future performance. Crypto trading activities are subject to high risk and volatility, always do your own research and use cold hard cash before investing. All activities of buying and selling Bitcoin and other crypto asset investments are the responsibility of the reader.
Reference:
- BeInCrypto. Ethereum Price: Whale Accumulation Signals Bottom, Analyst Says. Accessed on February 26, 2026
Latest News
© 2026 PT Pintu Kemana Saja. All Rights Reserved.
The trading of crypto assets is carried out by PT Pintu Kemana Saja, a licensed and regulated Digital Financial Asset Trader supervised by the Financial Services Authority (OJK), and a member of PT Central Finansial X (CFX) and PT Kliring Komoditi Indonesia (KKI). Crypto asset trading is a high-risk activity. PT Pintu Kemana Saja do not provide any investment and/or crypto asset product recommendations. Users are responsible for thoroughly understanding all aspects related to crypto asset trading (including associated risks) and the use of the application. All decisions related to crypto asset and/or crypto asset futures contract trading are made independently by the user.