Ethereum Climbs to $1,982 Today, but Downside Risk Still Points to the $1,800 Zone
Jakarta, Pintu News – Ethereum (ETH) price is under pressure again after a major on-chain event shook the market. Since March 6, ETH has dropped nearly 8%. This weakness came after a $157 million ETH transfer by Ethereum co-founder Jeffrey Wilcke was allegedly potentially dumped.
However, more in-depth on-chain data now indicates that some whale groups may actually be trying to absorb the selling pressure. So, how will Ethereum price move today?
Ethereum Price Up 1.69% in 24 Hours
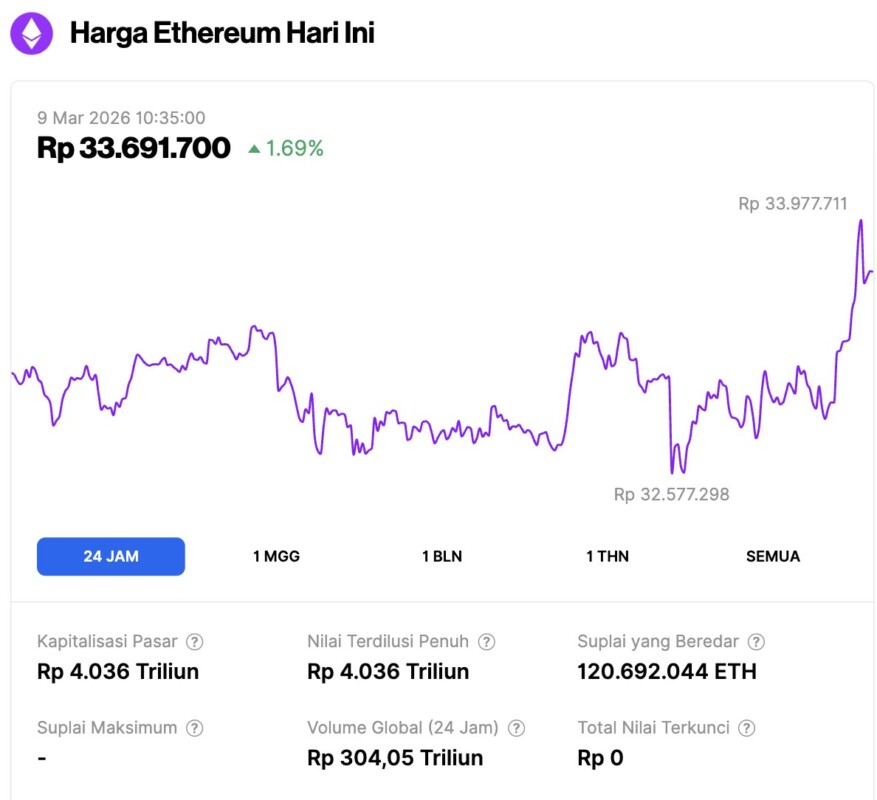
On March 9, 2026, Ethereum was trading at approximately $1,982, or about IDR 33,691,700, after gaining 1.69% over the past 24 hours. During that window, ETH dipped to a low of IDR 32,577,298 before climbing to a high of IDR 33,977,711.
At the time of writing, Ethereum’s market capitalization is estimated at around IDR 4,036 trillion. Meanwhile, daily trading volume surged 72% to roughly IDR 304.05 trillion over the same 24-hour period.
Read also: Bitcoin Hits $67,000 Today as Whales and Long-Term Holders Continue to Accumulate BTC
Co-Founder’s $157 Million Transfer Potentially Erroneous
Ethereum’s recent weakness began when Jeffrey Wilcke, one of the network’s co-founders, moved 79,176 ETH to the Kraken exchange, worth about $157 million based on current prices.
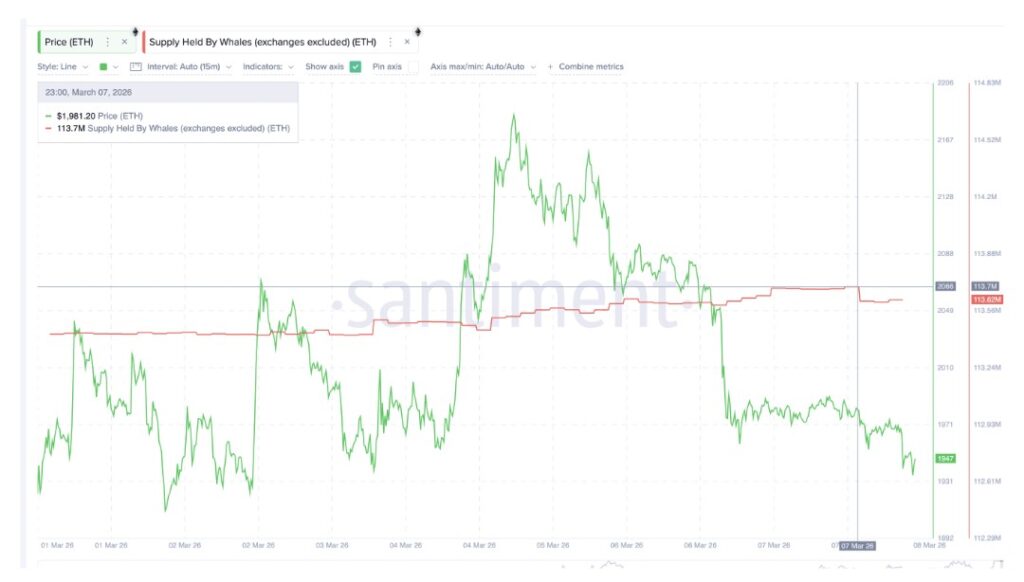
The movement of large amounts of assets to exchanges is often seen as a signal of a potential sell-off and usually has a negative impact on market sentiment. Shortly after this transfer was detected, standard whale metrics also showed a large decrease in ETH holdings.
Based on data tracking the supply of Ethereum held by whales outside of exchanges, the amount dropped by about 80,000 ETH-almost exactly the size of Wilcke’s transfer. This is an important detail.
Since whale metrics group many large wallets into one category, the movement of one very large wallet can look like a widespread whale selloff. In this case, the 80,000 ETH drop was closely aligned with Wilcke’s deposit, making it likely that the co-founder’s transfer was also “read” in the whale metrics.
In other words, what initially appears to be a massive distribution of whales could be just one large transfer from the founder level that appears in the aggregate data. This is why a more detailed analysis based on whale cohorts is crucial.
Accumulation Occurs in the Whale Cohort
When the whale data is examined in more detail using more balanced cohort metrics, the narrative changes significantly. The two main Ethereum whale cohorts actually increased their holdings over the same period.
The first group is wallets with balances between 1 million and 10 million ETH. This cohort started accumulating on March 5, with the supply rising from 6.28 million ETH to around 6.40 million ETH.
The increase equates to an additional approximately 120,000 ETH, worth approximately $234 million at current prices.
Read also: Top 4 Crypto Worth Watching in March 2026, Have Breakout Potential?
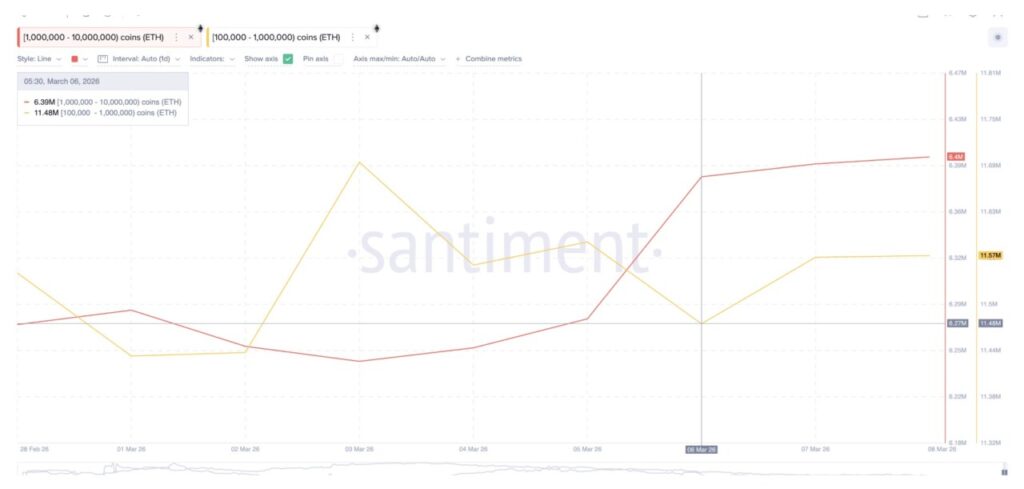
Another cohort, the wallets holding 100,000 to 1 million ETH, also started accumulating shortly after. Since March 6, their holdings rose from 11.48 million ETH to around 11.57 million ETH. This means they added almost 90,000 ETH, valued at around $175 million.
This accumulation indicates that some large investors may have stepped in to absorb the supply flowing into the market, thus containing some of the selling pressure. This also helps to explain why whale metrics in general had looked bearish, when some specific whale groups were actually increasing their exposure.
Momentum Signal and Rising Channel Pattern Show Contrary Movements
Even before the transfer from the co-founder appeared, Ethereum’s chart was already displaying a number of warning signs. On the 8-hour chart, ETH formed a hidden bearish divergence between February 14 and March 6. Within this span, the Ethereum price printed lower highs, while the Relative Strength Index (RSI) as a momentum indicator actually formed higher highs.
Hidden bearish divergence generally appears during a downtrend and often indicates that selling pressure is still strong despite a temporary rebound. After this signal formed, Ethereum weakened and eventually fell by almost 8%, with the decline further fueled by the alleged transfer of the co-founder.
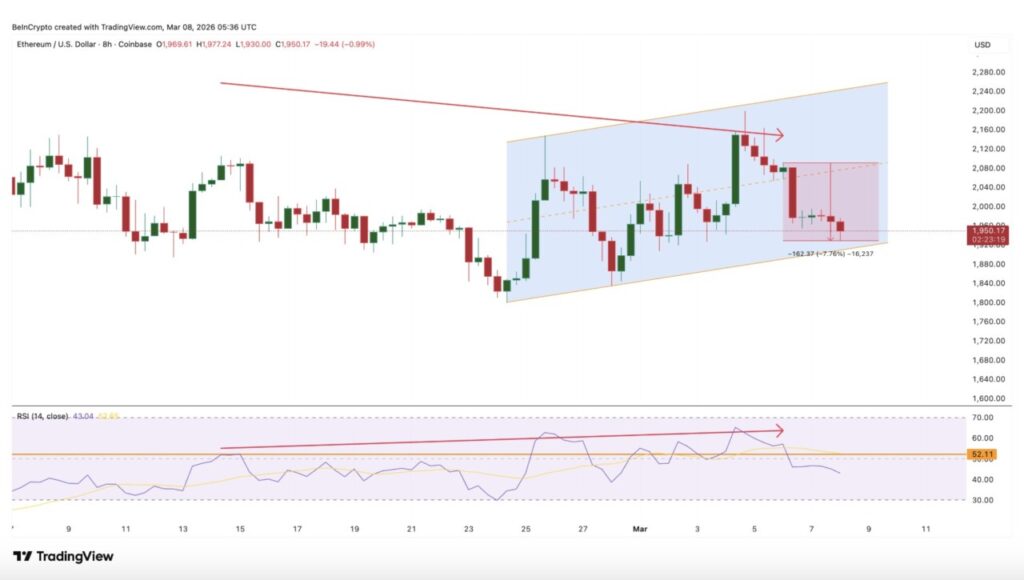
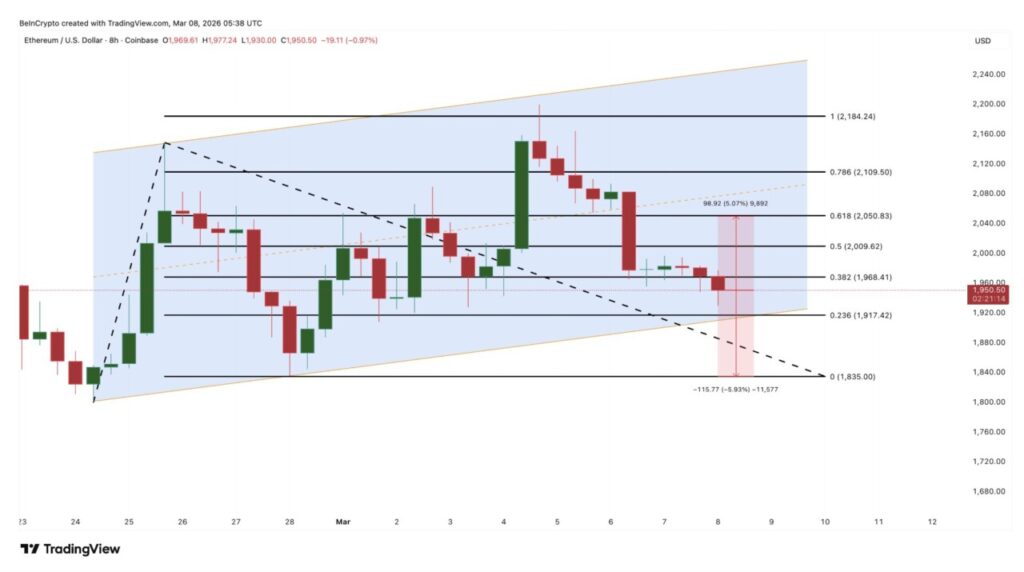
At the same time, since February 24, ETH has been moving inside a rising channel. This pattern suggests that buyers are still trying to build a short-term bullish structure. The channel may also explain why some whale cohorts keep accumulating.
However, that bullish structure is now under pressure. If Ethereum breaks below the lower boundary of the rising channel, the bearish momentum indicated by the RSI divergence could potentially accelerate. Nevertheless, whales are not the only cohort that remains optimistic.
Long-term Holders Keep Accumulating
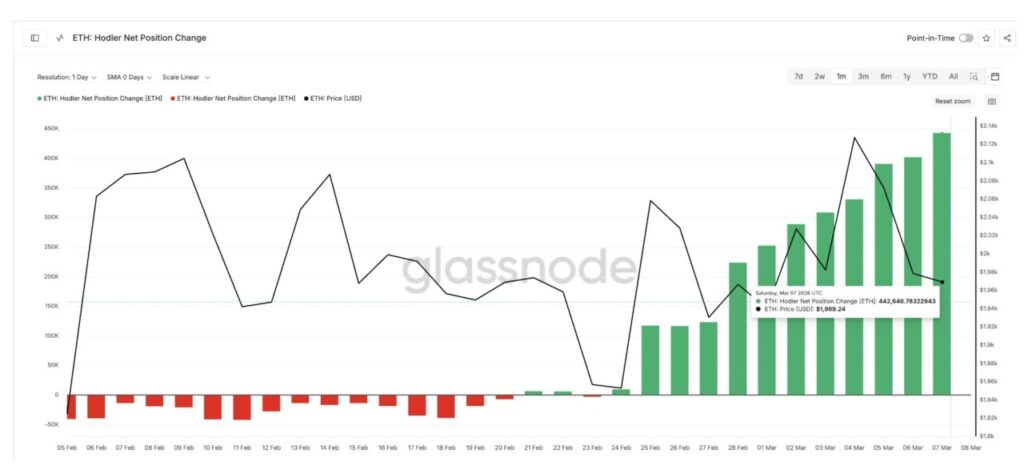
Despite increased selling pressure in recent times, long-term Ethereum holders have continued to add to their ETH holdings. Glassnode data shows that the 30-day Holder Net Position Change metric-which monitors wallets that hold ETH for 155 days or more-has been consistently moving up.
On February 24, long-term holders were recorded accumulating around 9,454 ETH. Since then, the numbers have jumped sharply. At the time of writing, the metric has increased to approximately 442,646 ETH, signaling the continued strong conviction of long-term investors. This equates to a surge of over 4,500% in less than two weeks.
Interestingly, this accumulation trend started more or less at the same time Ethereum entered a short-term rising channel (started forming on February 24). This indicates that this group of holders may still think the structure of the larger move is not yet broken. However, such optimism still carries risks.
Technically, Ethereum now needs to reclaim the $2,050 level which coincides with the 0.618 Fibonacci retracement level. A firm 8-hour candle close above $2,050 could potentially open up room for an increase towards $2,180.
On the downside, the key support is around $1,910. If Ethereum drops through this level, the scenario will confirm the breakdown of the rising channel. A follow-through move could push ETH towards $1,830, while approaching the $1,800 psychological area.
For the time being, the Ethereum market is caught between two opposing forces. Alleged founder sell-offs and technical weakness are increasing downward pressure, while whale accumulation and long-term holder conviction are still providing support. Whether ETH is able to stay above the channel or slips to the $1,800 area will likely determine the next phase of movement.
Follow us on Google News to stay up to date with the latest in crypto and blockchain technology. Check Bitcoin price, usdt to idr and tokenized nvidia stock price through Pintu Market.
Enjoy an easy and secure crypto trading and crypto gold investment experience by downloading the Pintu crypto app via Play Store or App Store now. Also, experience web trading with advanced trading tools such as pro charting, various order types, and portfolio tracker only at Pintu Pro.
*Disclaimer
This content aims to enrich readers’ information. Pintu collects this information from various relevant sources and is not influenced by outside parties. Note that an asset’s past performance does not determine its projected future performance. Crypto trading activities are subject to high risk and volatility, always do your own research and use cold hard cash before investing. All activities of buying and selling Bitcoin and other crypto asset investments are the responsibility of the reader.
Reference:
- BeInCrypto. Ethereum Price Risks Drop Below $1,800 if Whale Support Fails. Accessed on March 9, 2026
Latest News
© 2026 PT Pintu Kemana Saja. All Rights Reserved.
The trading of crypto assets is carried out by PT Pintu Kemana Saja, a licensed and regulated Digital Financial Asset Trader supervised by the Financial Services Authority (OJK), and a member of PT Central Finansial X (CFX) and PT Kliring Komoditi Indonesia (KKI). Crypto asset trading is a high-risk activity. PT Pintu Kemana Saja do not provide any investment and/or crypto asset product recommendations. Users are responsible for thoroughly understanding all aspects related to crypto asset trading (including associated risks) and the use of the application. All decisions related to crypto asset and/or crypto asset futures contract trading are made independently by the user.