Market Analysis Jan 2nd, 2024: Bitcoin Kicks Off 2024 with a Surge, Surpassing $45K

The final week of December presented a crypto market dilemma for Bitcoin investors. After falling below $44,000, BTC faced a critical support level at $42,500 over the past week. However, the beginning of 2024 opened with BTC surging to $45,000, the highest level since April 2022. For a deeper dive into potential BTC price scenarios, see the analysis below.
As usual, the Pintu trading team has gathered critical information and analyzed the general economic situation and the crypto market’s movements over the past week. However, it should be noted that all information in this Market Analysis is intended for educational purposes, not as financial advice.
Market Analysis Summary
- 🟢 The Federal Open Market Committee (FOMC) has kept the federal funds rate between 5.25% and 5.5% at recent meetings and has signaled a potential 0.75 percentage point rate cut in 2024.
- 📊 Falling inflation and steady interest rates set by the Fed have contributed to growth in the manufacturing sector, and anticipation of rate cuts in 2024 could further boost manufacturing activity.
- 💼 The unemployment rate in the United States (US) remained low at 3.7% in November, reflecting continued hiring by employers.
- ✍🏻 BTC corrected from a high of $44,000 earlier in the week to around $42,500. Support for BTC is at the 21-day exponential moving average (EMA) line, which if breached could lead to a significant decline.
Macroeconomic Analysis
PCE Price Index
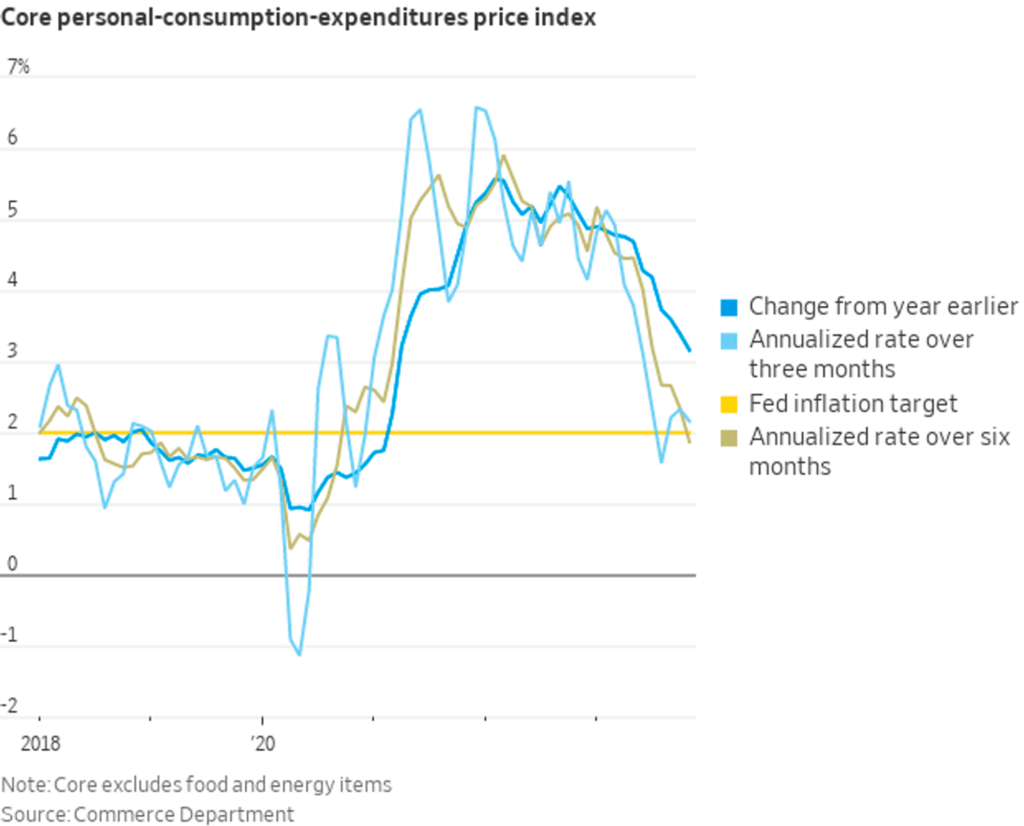
The core personal consumption expenditures (PCE) price index rose 0.1% month over month and 3.2% year over year, in line with expectations. The six-month increase of 1.9% indicates progress toward the Federal Reserve’s inflation target. Consumer spending and income in November were in line with forecasts, showing continued activity despite inflation.
Core PCE, which includes food and energy, declined slightly, in contrast to previous highs in the middle of the year. This trend suggests the potential for Federal Reserve rate cuts in 2024, depending on future core PCE data. The November report also noted a shift in consumer preferences, with prices of services rising and prices of goods falling.
Market focus remains on the Federal Reserve’s stance on inflation and its impact on interest rates. The Federal Open Market Committee (FOMC) has maintained the federal funds rate between 5.25% and 5.5% at recent meetings and has signaled potential rate cuts of 0.75 percentage points through 2024, with the first cut possibly occurring in March.
Other Economic Indicators
- Durable Goods: The manufacturing sector is showing signs of recovery amid easing inflation and the potential end of the Federal Reserve’s monetary tightening. In November, durable goods orders surged 5.4%, beating expectations and rebounding from a decline in October. This increase, driven largely by a surge in orders for transportation equipment, is part of a broader positive trend in manufacturing. Despite slow growth rates, the sector’s resilience is evident in the broader economy, with gross domestic product (GDP) expanding 4.9% in the third quarter. The Fed’s easing of inflation and stable interest rates have contributed to this increase, and anticipated rate cuts in 2024 could further stimulate manufacturing activity.
- Michigan Consumer Sentiment Index: The Michigan Consumer Sentiment Index, which measures consumer confidence in the United States, posted a significant increase in December, reversing the declines of the previous four months. The index reached 69.7, up 8.4 points (13.7%) from November’s final reading and slightly above the forecast of 69.4. The monthly survey, conducted by the University of Michigan, measures consumer attitudes about the economy, personal finances, business conditions, and purchasing conditions. It releases two reports each month: a preliminary report at mid-month and a final report at the end of the month.
- New Home Sales: Sales of new homes in the United States fell 12.2% in November to a seasonally adjusted annual rate of 590,000, weighed down by high mortgage rates. The figure, reported by the U.S. Department of Housing and Urban Development and the U.S. Census Bureau, was the lowest since November 2022. However, year-to-date sales were still up 3.9%, largely due to a lack of resale inventory. The National Association of Home Builders expects a positive turn in home sales into the new year, with the economy potentially moving past peak interest rates.
- Jobless Claims: The U.S. Labor Department reported a higher-than-expected number of new jobless claims for the week ending Saturday, with 218,000 new claims filed. This was above the forecast of 215,000 and the previous week’s revised figure of 206,000. The four-week moving average, a more stable indicator of employment trends, showed initial claims at 212,000, down slightly from the previous week. This data will be closely watched as it could indicate a cooling labor market, which is especially significant given the economy’s recent 4.9% GDP growth in the third quarter. Despite predictions of interest rate hikes impacting the labor market, the unemployment rate remained low at 3.7% in November, reflecting employers’ continued expansion of their workforces.
BTC Price Analysis
For the past few weeks, it seems that those skeptical about BTC have given in, relinquishing their negative stance on the token, while those optimistic about it maintain control over the gains. This indicates the possibility of significant price movement on the horizon.
Historically, December has been favorable for altcoin breakouts, particularly meme coins experiencing notable gains. Nevertheless, BTC was anticipated to surpass both $45,000 and $42,000. Traders were eagerly anticipating catalysts that could propel its surge. Despite this, Bitcoin exceeded $42,000, instilling hope in investors for a climb to $43,000, provided that buyer activity remained robust. However, uncertainty lingered due to fluctuations in active addresses.
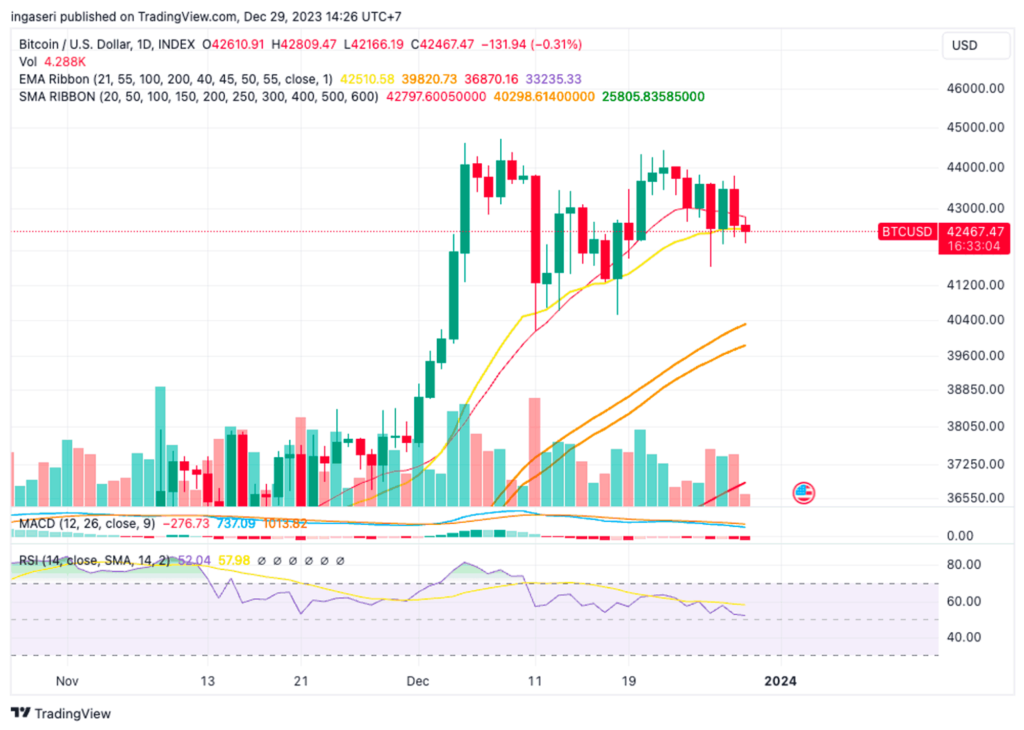
BTC remains in the vicinity of $42,500, encountering substantial volatility in its efforts to sustain its position above recent gains. Despite bearish endeavors to push the BTC price downward, the bulls have managed to keep it close to the gains. Over the past few days, selling pressure has notably diminished, with the bulls exerting considerable effort to regain momentum. This hints at the possibility of a notable price movement in the near future, although the specific direction of the breakout remains uncertain.
With widespread anticipation for the approval of the Spot ETF, there’s potential for a significant market shift and a robust rally. The price currently maintains a heightened range, reinforcing the prevailing bullish momentum. The next hurdle is anticipated around $43,100, following the breach of $42,850.
BTC has corrected from its heights of $44,000 in the early part of the week to the current price point of $42,500. The price is supported by the 21 days EMA line, a breakdown from this line could present a substantial downturn.
In the event of a potential pullback, $41,500 could serve as a crucial support level, signaling buyer interest if a decline occurs. A robust support zone at $40,500 is poised to mitigate the risk of a substantial downturn.
💡 On January 2, 2024, Bitcoin (BTC) underwent a rapid climb, surging more than 6% to surpass the $45,000 mark for the first time since April 2022. This upward trajectory was largely driven by expectations surrounding the potential approval of a Bitcoin Spot ETF by the SEC.
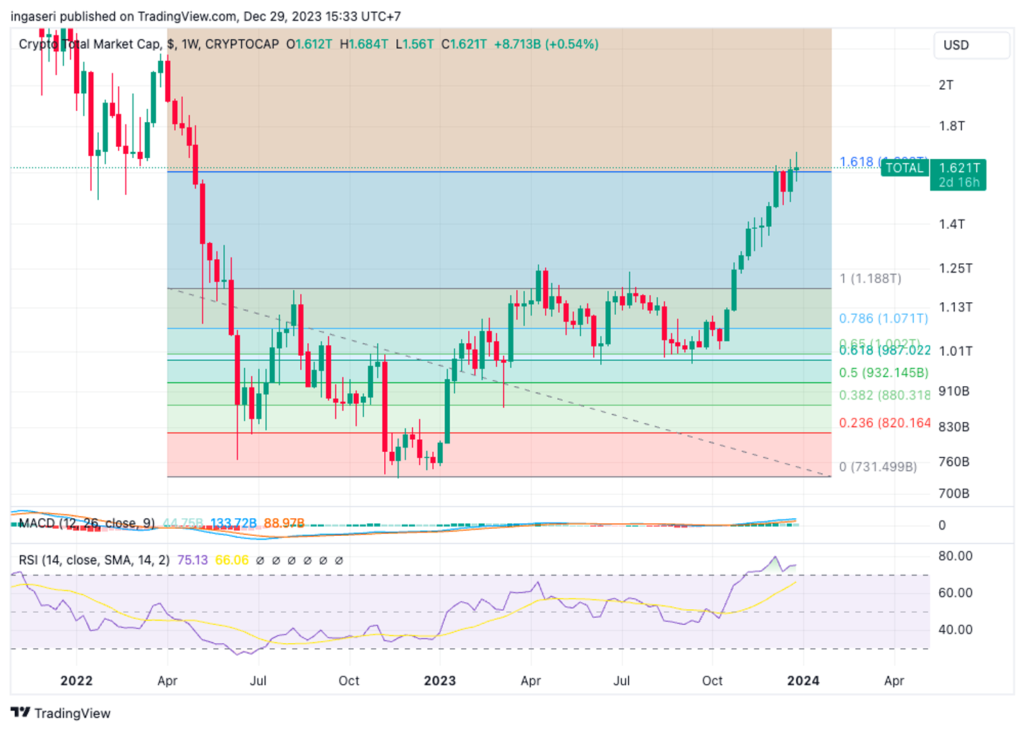
The total crypto market is at 1.621 Trillion USD, surpassing the weekly 1.618 Fibonacci line, making support for the price action.
Several significant factors are influencing the crypto market. In the US, the impending 2024 elections are playing a role. Additionally, there is anticipation regarding the SEC’s approval of special Bitcoin investments, a development that holds significance for the President’s re-election plans.
At present, the landscape of the crypto market is a complex interplay of technical aspects, growing interest in various coins, and the ramifications of global political dynamics and regulatory frameworks. Investors and experts are diligently observing these variables to discern the potential trajectory of BTC and its impact on other digital currencies.
On-Chain Analysis
- 📊 Exchange: As the exchange reserve continues to fall, it indicates lower selling pressure. Net deposits on exchanges are low compared to the 7-day average. Lower deposits can be interpreted as lower selling pressure.
- 💻 Miners: Miners’ are selling more holdings compared to their one-year average. Miner’s revenue is in a moderate range, compared to its one-year average.
- 🔗 On-Chain: More investors are selling at a profit. In the middle of a bull market, it can indicate a market top. Long-term holders’ movement in the last 7 days was lower than the average. They have a motive to hold their coins. Investors are in an anxiety phase where they are currently in a state of moderate unrealized profits.
- 🏦 Derivatives: Long-position traders are dominant and are willing to pay short traders. Selling sentiment is dominant in the derivatives market. Takers fill more sell orders. As open interest decreases, it indicates investors are closing futures positions and the possibility of trend reversals. In turn, this might trigger the possibility of long/short squeeze caused by sudden price movement or vice versa.
- 🔀 Technicals: RSI indicates a neutral condition. Stochastic indicates a neutral condition where the current price is in a moderate location between the highest-lowest range of the last 2 weeks.
News About Altcoins
- Solana Network Activity Breaks Record. Lately, Solana (SOL) has been in the spotlight, experiencing a significant price spike that pushed it over $100, a remarkable recovery from its post-FTX collapse below $10. This resurgence is being fueled by the hype surrounding Saga phones, which are loaded with BONK airdrops and fetching high prices on eBay. Adding to the momentum, the Solana network has broken records for new and active monthly addresses, with the number of active addresses increasing by 50% since November to over 15.6 million, surpassing the previous record of 15.2 million set in January. This extraordinary growth underscores Solana’s growing prominence in the cryptocurrency landscape.
News from the Crypto World in the Past Week
- BlackRock moves forward with IBIT spot bitcoin ETF. BlackRock has updated its S-1 filing with the SEC for its proposed Spot Bitcoin ETF, now called IBIT, detailing new aspects of its creation and redemption mechanism. The amendment suggests a preference for a cash redemption model while retaining the option of an “in-kind” process, pending regulatory approval. This development follows discussions between BlackRock, Fidelity, Ark 21Shares, WisdomTree, and the SEC regarding the redemption process for spot bitcoin ETFs. While BlackRock is seeking the flexibility of an “in-kind” model, the SEC appears to prefer a cash model that requires the immediate sale of bitcoin for cash redemptions. The market has reacted positively to these developments, anticipating an imminent decision on the approval of such ETFs.
Cryptocurrencies Market Price Over the Past Week
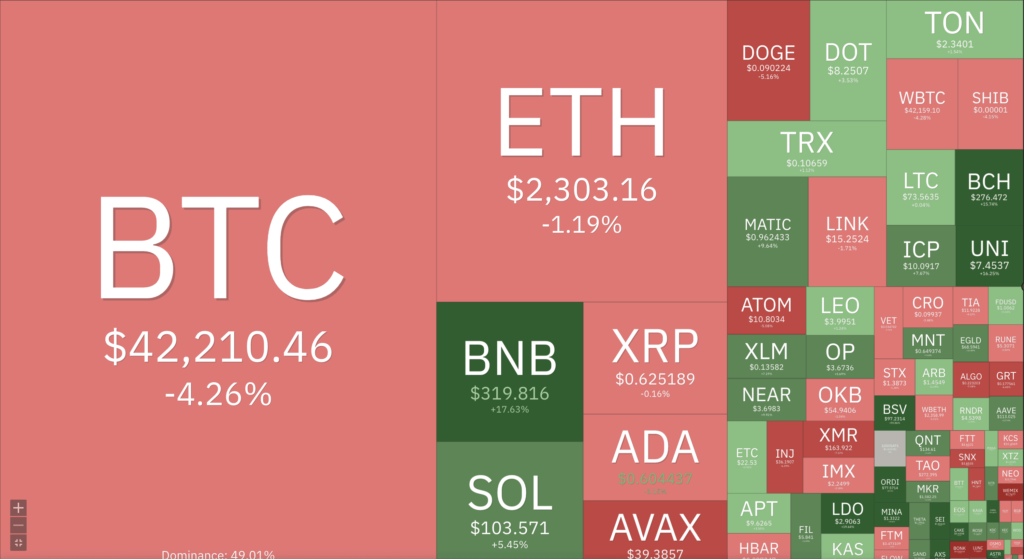
Cryptocurrencies With the Best Performance
- Sei +53,04%
- ORDI +52,92%
- Mina (MINA) +45,79%
- Tellor (TRB) +43,48%
Cryptocurrencies With the Worst Performance
- Bonk (BONK) -22,97%
- Avalance -13,52%
- Immutable -10,74%
- Beam (BEAM) -8,93%
References
- Sarah Wynn, BlackRock’s proposed spot bitcoin ETF gets a ticker in latest filing with SEC, theblock, accessed on 30 December 2023.
- Zack Abrams, Solana sets records for monthly new and active addresses amid price rally, theblock, accessed on 30 December 2023.
Share
Related Article


See Assets in This Article
BTC Price (24 Hours)
Market Capitalization
-
Global Volume (24 Hours)
-
Circulating Supply
-