What is Descending Triangle?

In evaluating an asset, traders and investors must conduct technical analysis to identify market trends. One key element of technical analysis is identify support and resistance lines, which can help us to monitor price movements and identify forming patterns. By understanding the connection between support and resistance, traders can spot potential trend reversals or continuations. One pattern in technical analysis that may signal a bearish or bullish trend is the descending triangle. What is descending triangle?
Article Summary:
- Descending Triangle: A technical chart pattern forming a triangle shape when an asset’s price shows a downward trend with lower highs that continuously decrease and lower lows that remain at the horizontal support level.
- The Descending Triangle is often used by traders and investors because it can indicate a continuation of bearish sentiment.
- By understanding the Descending Triangle pattern, you can effectively identify market opportunities and reduce trading risks.
What is Descending Triangle?
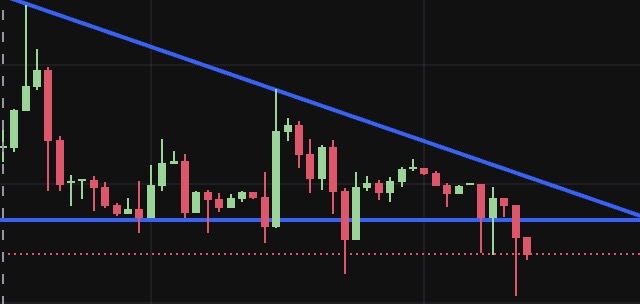
Descending Triangle is a technical chart pattern that forms a triangle shape when an asset’s price shows a downward trend with lower highs that continuously decreasing and lower lows remaining at the horizontal support level. This pattern indicates increasing selling pressure. If the price breaks below the support level, it signals a potential continuation of the bearish trend.
However, if buying demand strengthens significantly, this pattern can lead to a bullish reversal. This implies that the price may reverse and rise toward a higher resistance level.
Why Is the Descending Triangle Often Used?
Traders and investors often use the Descending Triangle because it can indicate a continuing bearish sentiment. This pattern can be identified using technical analysis indicators such as the Moving Average, support and resistance levels, and transaction volume.
In general, this pattern continues when the price is below the 50 or 200 Moving Average. You should be cautious of price movements that are significantly below this Moving Average, as it indicates bearish momentum and the formation of the Descending Triangle pattern.
It is important to examine the horizontal support level in order to determine to what extent the Descending Triangle pattern will form. IA continuing downward trend can be identified when the price consistently declines, breaking through the horizontal support level, and buying pressure has weakened.
Although this pattern gives caution signals, you can take advantage of the momentum by opening a short position if the pattern confirms a continuing downward trend, such as breaking the support line and a price decline from the Descending Triangle resistance area.
The Descending Triangle pattern can form when a bullish trend occurs or during an accumulation/sideways period. It is common to find this pattern forming when selling pressure is much higher and volume is decreasing, allowing you to identify that the downward trend continues to the next support level. If the support is retested repeatedly and the price increases, forming a reversal pattern that successfully breaks through the resistance line of the Descending Triangle, this could signal the beginning of a new reversal trend.
How to use Descending Triangle for Trading?
By understanding the Descending Triangle pattern, you can effectively identify market opportunities and reduce trading risks.
1. Avoid purchasing assets in the resistance area of the Descending Triangle
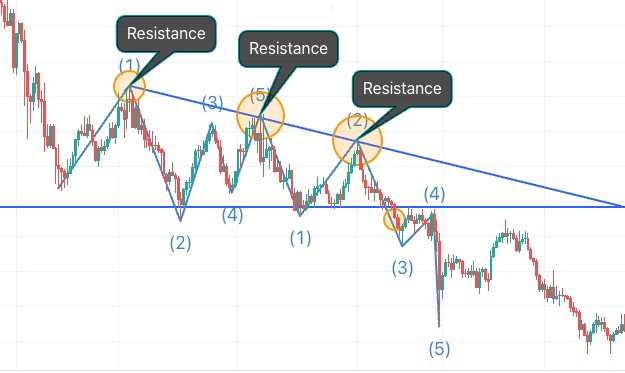
As the price continues to decline and forms lower highs, it is best to avoid buying in the resistance area. Price rejection in this area is likely to occur if there is no catalyst driving bullish market sentiment. You can use this momentum to open a short position when the price fails to hold at the horizontal support level and falls while attempting to break through resistance.
2. Breakout Validation
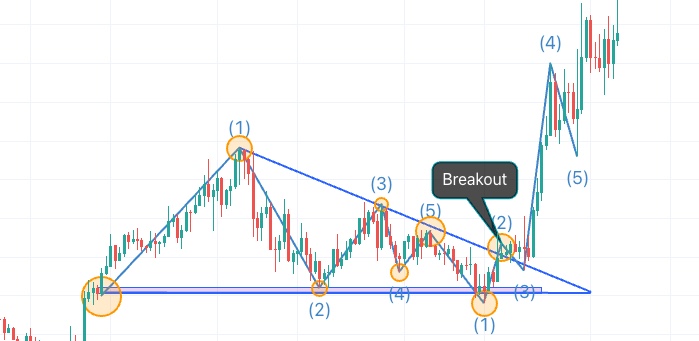
One effective way to use the Descending Triangle pattern is to wait for breakout confirmation. When the price continues to experience a significant decline and breaks through the horizontal support level with large volume flowing into the asset, it can be concluded that a downward trend is underway. You can accumulate assets by waiting for the price to successfully break out from the highest point of the Descending Triangle pattern, along with increasing buying volume.
3. Determine Profit Target and Stop Loss
After a breakout occurs, it is important to be disciplined in determining the appropriate profit target and stop loss. One method you can use to determine the price target is to measure the distance between the highest point of the Descending Triangle pattern and the horizontal support level. This distance can then be applied to the breakout point to estimate the potential price movement after the breakout.
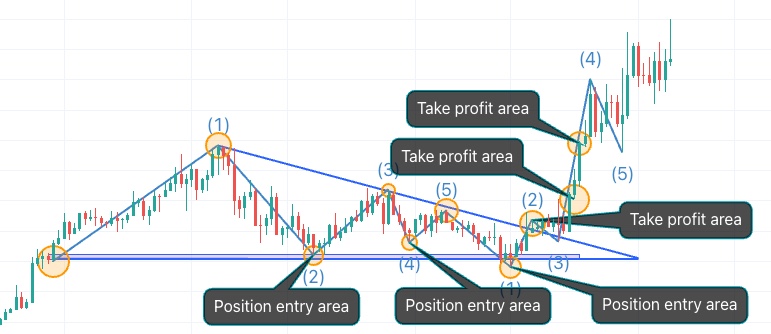
Tip: The profit target can be placed above the resistance level of the Descending Triangle pattern if the price moves up after the breakout. This target placement aims to avoid losses due to false breakouts and ensure the opportunity to gain profit from price movements. Meanwhile, the horizontal support area can be used as an entry point to maximize the potential profit from this pattern.
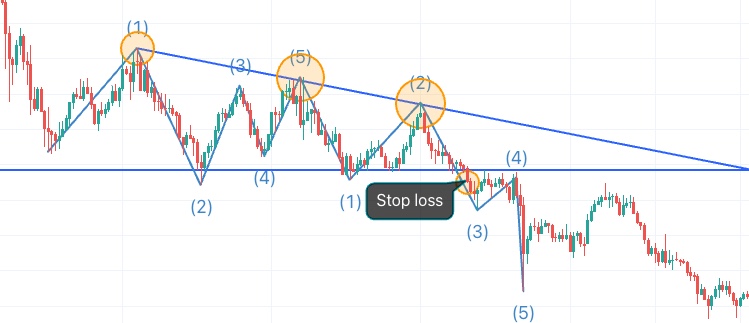
Tip: A stop loss can be placed slightly below the support level if the price moves down and breaks through the horizontal support area. This is important to protect your trading position from the possibility of a rapid and significant price decline.
4. Observe Transaction Volume
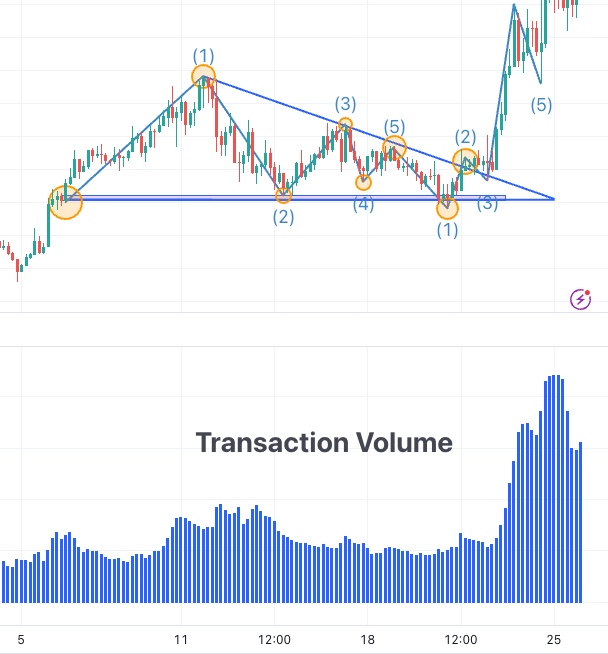
Trading volume is a key factor that should not be ignored when analyzing the Descending Triangle pattern. During the formation of this pattern, trading volume typically decreases along with the price decline, indicating that selling pressure is strengthening. However, when a breakout occurs, volume must increase to confirm the validity of the price movement.
High volume during a breakout indicates that the market is responding positively to the pattern, increasing the probability of the price moving upward. Conversely, if the volume remains low or shows no significant increase at the breakout, the price movement may reverse direction or stagnate over time.
5. Analyzing New Patterns
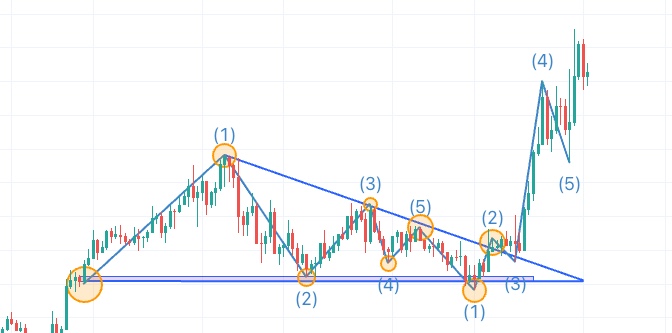
After a breakout occurs, it is also important to monitor the development of other patterns that may provide additional signal references. For example, if the breakout from the Descending Triangle is followed by a pattern like a bull flag or other bullish reversal formations, this could indicate that the market is indeed reversing direction and that the price may continue to rise after the Descending Triangle pattern.
Otherwise, if a pattern such as a bearish engulfing or other bearish candlestick formations appears after the breakout, it could indicate that the bearish trend will persist. Therefore, do not rely solely on the Descending Triangle pattern; it is also important to observe the development of other technical patterns to strengthen your analysis and trading decisions.
Disclaimer: All articles from Pintu Academy are intended for educational purposes only and do not constitute financial advice.
Conclusion
The Descending Triangle is a significant technical pattern used to identify the potential continuation of bearish or bullish trends. This pattern is defined by a descending resistance line and supported by a decrease in trading volume during its formation.
You can take advantage on this pattern by waiting for breakout confirmation, setting a profit target based on the pattern’s height, and monitoring trading volume to validate the breakout.
Although it carries risks, this pattern offers significant opportunities when paired with strategies such as support/resistance analysis, stop-loss management, profit targeting, and identifying other advanced patterns to maximize profit potential.
Reference
- James Chen, Descending Triangle: What It Is, What It Indicates, Examples, Investopedia, accessed on November 8, 2024.
- Arjun Remesh, Descending Triangle: What Is It? Importance, How to Trade, and Benefits, Strike Money, accessed on November 8, 2024.
Share
