Market Analysis 29 August-3 September: Potential Upside Momentum for ETH and BTC Warning

Bitcoin ended August with -14%. Meanwhile, the eurozone financial condition is experiencing difficulties with inflation reaching 9.1%. There is some potential bearish in Bitcoin and Ethereum price movements. Check out the market analysis below to find out more!
The trader team of Doors collects various important data about the price movements of the crypto asset market over the past week which is summarized in this Market Analysis. However, you should note that all information from this Market Analysis is for educational and informational purposes, not financial advice.
Market Analysis Summary
- 🏦 The country’s financial condition in the eurozone region is experiencing difficulties with inflation reaching 9.1%
- ️⚠️ August was the first time BTC closed and started a new monthly candle below the 50-month MA. This point is a crucial point historically.
- ️⚖️ BTC broke out of the bear flag pattern and is once again below the Week 200 MA.
- 🔍 There are some similarities between the current and 2018 ETH price movements, especially in the crosses between the MA lines.
Macroeconomy Analysis
Eurozone (19 European Union monetary countries) inflation hit a new record this month, at 9.1%, 0.1% higher than consensus. The European Central Bank previously raised interest rates by 50 bps in July, the first rate hike in 11 years. It is unlikely that there will be another hike on September 8. Furthermore, European countries are in a difficult situation due to the now unavoidable recession risk.
The market will still be volatile as it awaits August unemployment rate figures, CPI data on September 13, and the FOMC meeting on September 21-22. There is still uncertainty about whether inflation has peaked in the US. Therefore, September will be a volatile month. We seem to have to wait even longer before the market price trend reversal occurs.
Ethereum Price Movement 29 August-3 September 2022
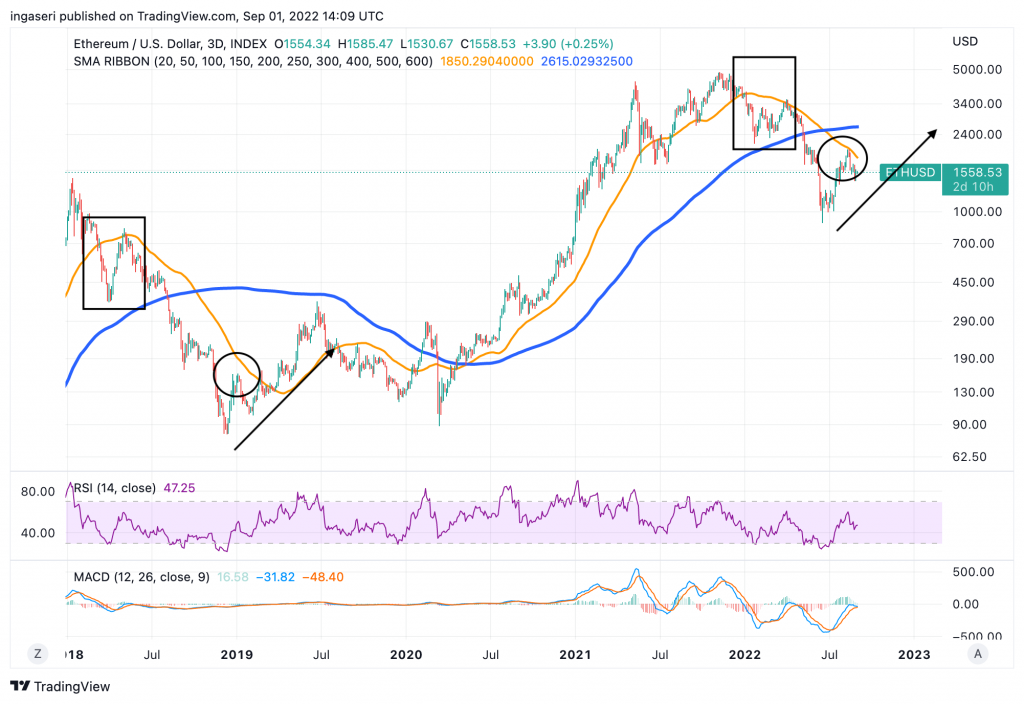
Looking at the 3-day chart for ETH, we can see that the current ETH pattern is a repeat of what happened in 2018. The Orange line is the 50-day MA and the blue line is the 200-day MA. In 2018, once ETH hit the resistance of the 50-day MA (rectangle), it fell again and reached another resistance at the 50-day MA (circle). The same thing is happening today. If what happens is similar, we will see a positive momentum return once ETH hits the 50-day moving average.
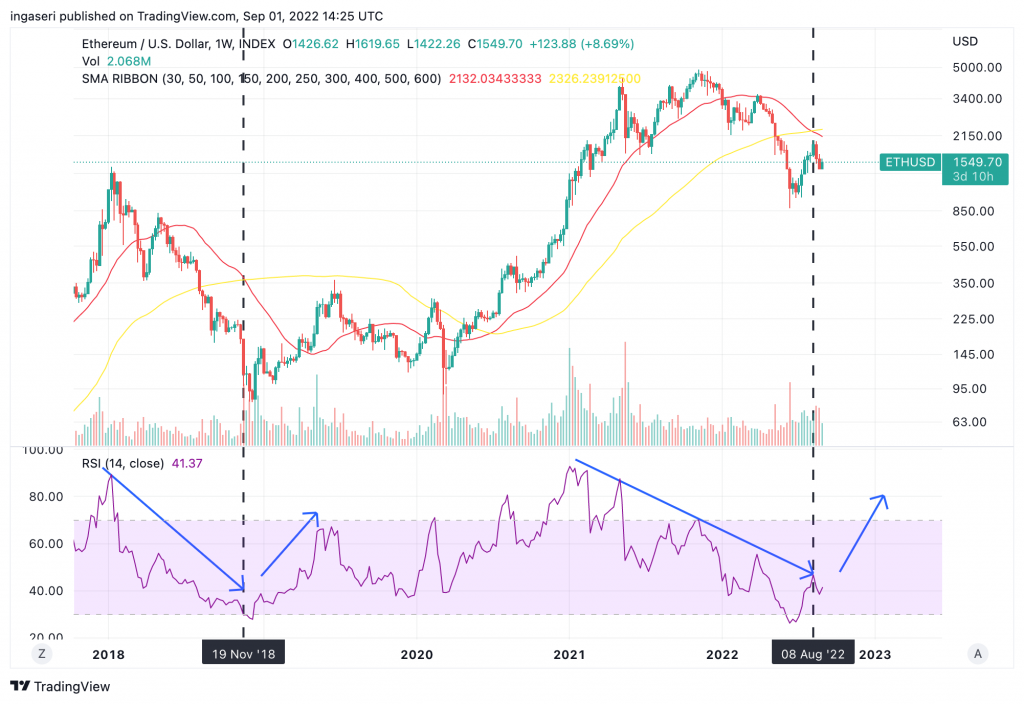
On the weekly chart of Ethereum, we can see a repeating pattern. In 2018, we saw a cross between the 30-day MA (red line) and 100-day MA (yellow line), this coincidentally marks the lower limit of the RSI indicator in a bear market. Next, there is momentum pushing the price up which is confirmed by the 30-day MA crossing and past the 100-day MA (which takes 1+ year). Today, we just had a cross between the 30-day MA and the 100-day MA. We may see upward momentum in the short term before moving sideways and finding positive momentum.
BTC Price Movement 29 August-3 September 2022
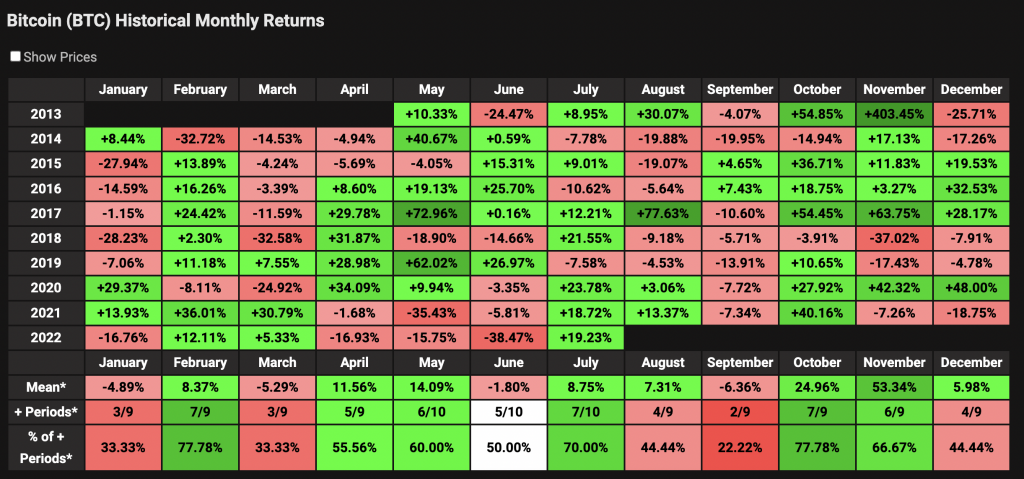
August ended with the BTC price having a percentage return of -14%. Repeating last week’s market analysis, September has always been a red month for BTC. Of the previous 9 September months, only 2 months were green (vs. 7 red months).
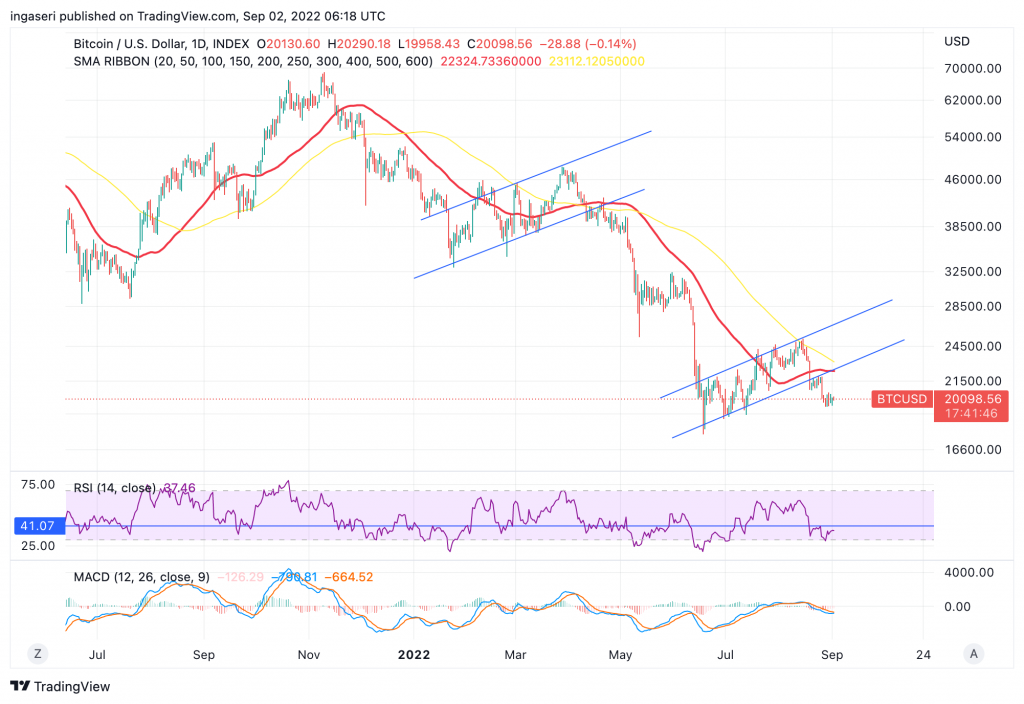
Over the past week, we have seen BTC weaken after breaking out of the bear flag pattern. BTC is currently down 9% and -15% MoM. Currently, we are going through a mid-term consolidation phase. We have a psychologically critical support point at $20k. The next support level is $19,000 US dollars. On the daily chart, we can see a potential bearish crossover of the 50 MA and 100 MA, which could accelerate the negative momentum.
Note that the daily RSI faces resistance to the key figure at 41.
Learn about other aspects of technical analysis that can help you analyze price patterns.
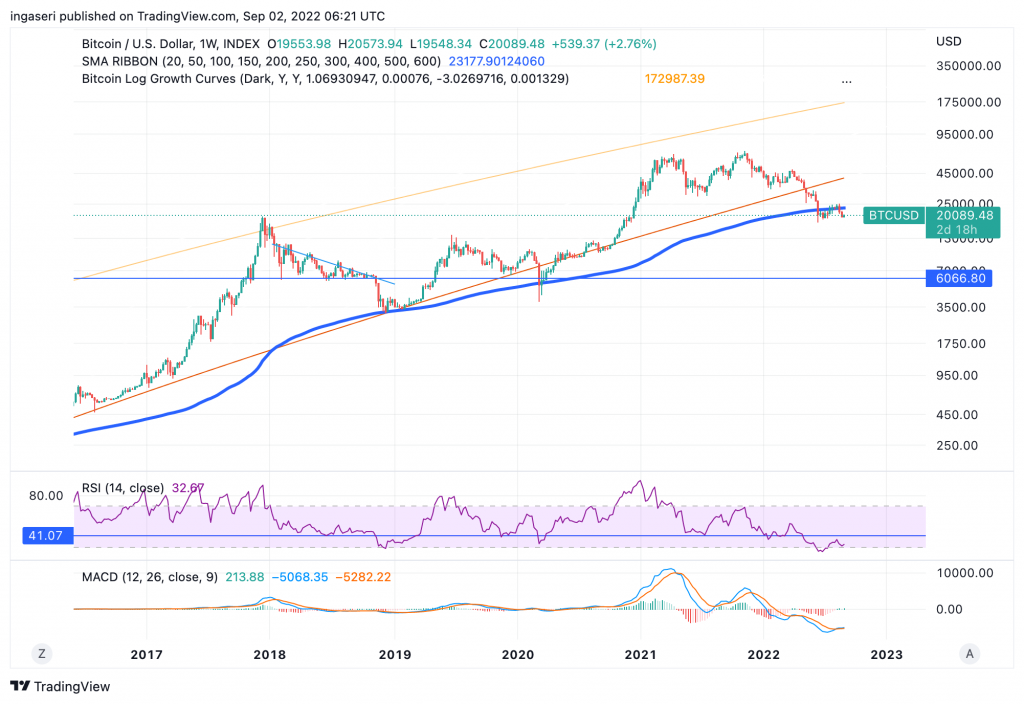
On the weekly chart, we once again see BTC below the 200-week moving average, which has historically been a good buying opportunity. Notice that we haven’t gone up to any new resistance and support is still at $19k. If we fall from here, the bearish momentum will increase. Looking at the bitcoin log growth curve, we are at the bottom. This is another good buying opportunity indicator.
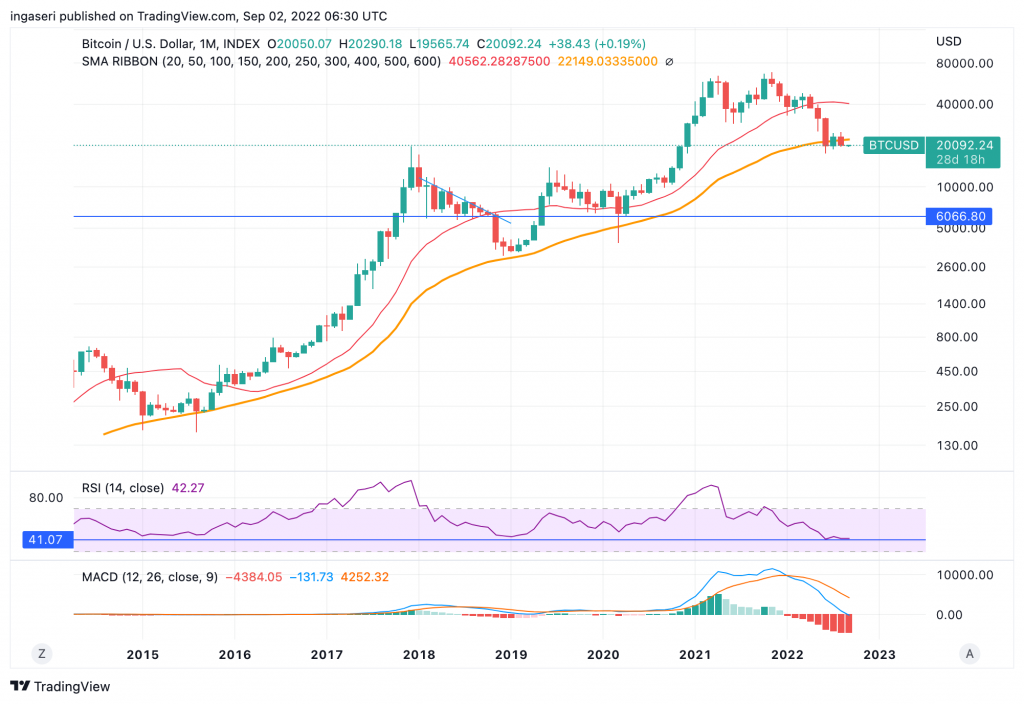
On the monthly chart, this is the first time BTC has closed and started a new monthly candle below the 50-month moving average. Historically, the 50-month MA line is a very strong support point. On a macro level, there is a possibility of a new low.
On-Chain Analysis
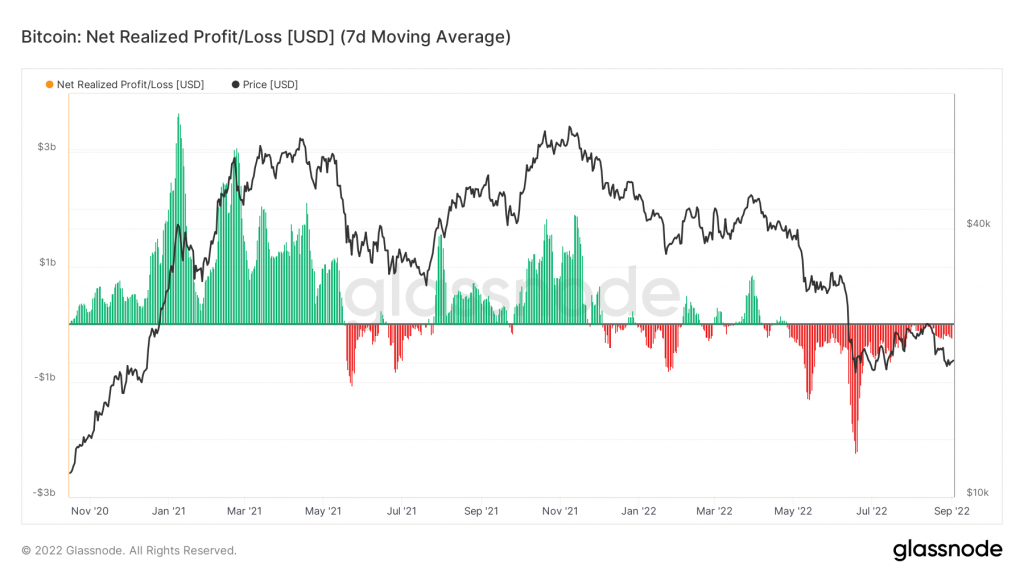
Looking at BTC’s net realized P/L, in aggregate BTC investors, are selling at a loss since Mid April this year. What is positive though, is that the losses realized are in decreasing trend. Breaking above zero would mean that market sentiment will be positive.
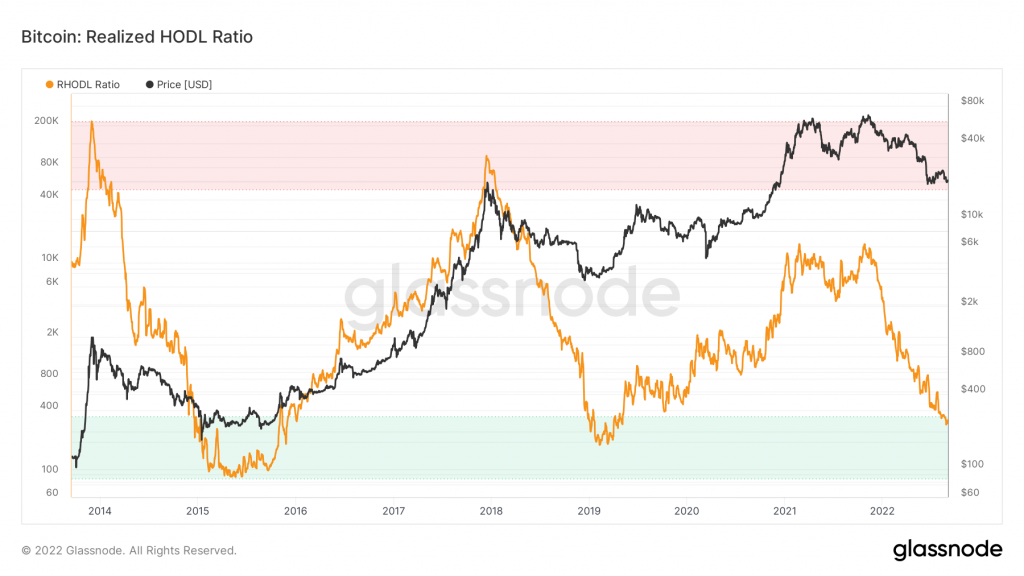
Next, let’s look at Realized HODL Ratio. This indicator aims to identify extremes in market psychology over time to accurately identify Bitcoin global cycle highs and lows. It is able to forecast where the Bitcoin price may need to pull back when the RHODL Ratio line approaches the upper red band, and when it may rally after spending time in the lower green band. Notice that we are finally at the green band, where market reversal will be imminent. The question is how long will we be spending below the green band.
- 📊 Exchange: When foreign exchange reserves rise, this indicates higher selling pressure. Net deposits on the exchange are quite high compared to the 7-day average. Higher deposits can be interpreted as higher selling pressure.
- 💻 Miners: Miners sell holdings in a moderate range compared to their one-year average. Miners’ income has decreased significantly compared to the costs they incur. This can indicate that the price of BTC is undervalued and miners have to hold onto their coins.
- 🔗️ On-Chain: More investors sell at a loss. In the middle of a bear market, it can indicate the lower limit of the market. The movement of long-term holders in the last 7 days was lower than average. They have a motive for holding their coins. Moreover, investors are in a capitulation phase where they face unrealized losses. This indicates a decrease in the desire to realize losses so that selling pressure decreases.
- 🏦 Derivative Market: Traders in long positions are dominant and willing to pay for short traders. Buying sentiment is dominant in the derivatives market. More buy orders are filled by takers. When open interest decreases, this indicates investors are closing futures positions and there may be a trend reversal. This can trigger the possibility of a long/short squeeze caused by a sudden price movement.
Altcoins News
- ⚽ FIFA launch of NFT platform in Algorand: FIFA’s NFT platform, named “FIFA+ Collect” will launch at the end of September. This NFT platform will give football fans the opportunity to own an NFT that captures iconic moments from the sport they love. FIFA+ Collect will live on the Algorand network (ALGO).
- 🧬 Helium plans to move to Solana: The development team behind Helium (HNT) made a proposal to move its network over to Solana. This proposal was made because the Helium development team said they were facing some technical hurdles regarding the operation of the network.
- 🌐 Polygon integrated with Robinhood and Meta: Robinhood and Meta have just announced the integration of the Layer-2 Polygon (MATIC) network into their respective platforms. Robinhood users can now deposit and withdraw MATIC within its network. Meanwhile, Meta via Facebook and Instagram now has a cross-post feature for NFT from Polygon.
More News from Crypto World in the Last Week
- ☠️ DeFi app development team discontinued its own app: OptiFi, one of the DEX’s on Solana, announced that its development team accidentally permanently terminated the app. This occurs due to an error during the OptiFi protocol update process. So, a total of $661,000 USDC is locked and permanently lost but OptiFi said it will refund affected users.
- 👜 Hermes enters Metaverse and NFT: The well-known fashion brand, Hermes, has just applied for a trademark for its name in relation to Metaverse products, NFT, a virtual marketplace, as well as a virtual fashion show.
- 🎟️ Ticketmaster uses Flow for NFT tickets: Ticketmaster, one of the giants in the ticketing industry, owns DapperLabs’ blockchain Flow to print NFT tickets. In its inaugural program, Ticketmaster has already scored five million NFT within six months. Furthermore, Ticketmaster has built a virtual wallet and marketplace feature on its site.
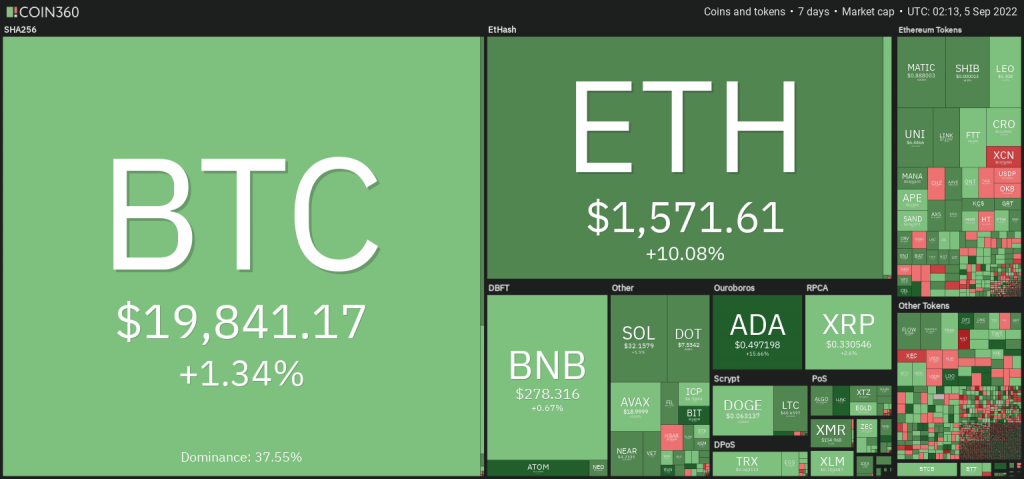
Cryptocurrency Market Price Over the Past Week
Cryptocurrency With the Best Performance
- EOS (EOS) +14,32%
- Chiliz (CHZ) +6,28%
- LIDO DAO (LDO) +24%
- Polygon (MATIC) +15,6%
- Cardano +15,3%
- Chainlink +13,8%
- Flow (FLOW) +12,8%
Cryptocurrency with the Worst Performance
- Lido DAO (LIDO) -27,46%
- Curve – 27,47%
- NEAR Protocol -27,38%
- Thorchain (RUNE) -25,35%
- Gala Games -25,26%
References
- Sander Lutz, FIFA Launches NFT Platform on Algorand in Run-Up to World Cup, Decrypt, accessed on 5 September 2022.
- Brayden Lindrea, Helium devs propose ditching own blockchain for Solana, Coin Telegraph, accessed on 5 September 2022.
- Sujith Somraaj, Polygon Jumps 10% Over The Week Amid Robinhood, Meta Integrations, Decrypt, accessed on 5 September 2022.
- Andrew Hayward, Solana DeFi Exchange Accidentally Bricks Itself, Locks Up $661K Forever, Decrypt, accessed on 5 September 2022.
- Judith Bannermanquist, Hermès reveals plans for Metaverse fashion shows, crypto and NFTs, Coin Telegraph, accessed on 5 September 2022.
- Kate Irwin, Ticketmaster Chooses Dapper Labs’ Flow Blockchain for NFT Tickets, Decrypt, accessed on 5 September 2022.
Share
Related Article


See Assets in This Article
LINK Price (24 Hours)
Market Capitalization
-
Global Volume (24 Hours)
-
Circulating Supply
-